Chapter-7
Commission’s Analysis and Decisions
on Revenue Requirement
for the year 2005-06
A. CATEGORYWISE ENERGY DEMAND (SALES)/ T&D LOSSES AND TOTAL ENERGY REQUIREMENT
7.1 ENERGY SALES FOR THE YEAR 2005-06
7.1.1
Accurate projection of category-wise energy sales is very essential for the assessment of energy requirement to arrive at the quantum of power purchase requirement and for the assessment of revenue. The Commission has examined the category-wise sales projected by the Board in its ARR and Tariff Application. The consumption by all categories of consumers other than agricultural pumpsets is metered. The consumption by agricultural pumpsets is assessed by the Board based on sample meter readings of AP consumers. The Board has projected aggregate sales at 25,837 MU for the year 2005-06 which include metered sales within the state at 17539 MU, consumption by agricultural pumpsets at 7364 MU, sales to common pool consumers at 381 MU and outside state sales at 553 MU.
7.1.2
Metered Energy Sales
Category-wise actual sales for the years 2000-01, 2001-02, 2002-03 & 2003-04, CAGR for 3 years (2000-01 to 2003-04), revised estimates of sales for 2004-05 and projected sales for the year 2005-06 as per ARR for the year 2005-06, are given below in Table 7.1.
Table - 7.1
Energy Sales to Metered Categories as per ARR 2005-06
| Metered | Actual for00-01 | Actual for 01-02 | Actual for 02-03 | Actual for 03-04 | 3yr.CAGR for 00- 01 to 03-04 | REfor04-05 | Projection for05-06
|
|---|
| 1 | 2 | 3 | 4 | 5 | 6 | 7 | 8
|
| Domestic | 4261 | 4476 | 4913 | 5271 | 7.35% | 5659 | 6075
|
| Commercial | 962 | 1044 | 1204 | 1299 | 10.53% | 1436 | 1587
|
| Small Power | 661 | 651 | 642 | 671 | 0.49% | 675 | 678
|
| Medium Supply | 1195 | 1400 | 1474 | 1559 | 9.29% | 1704 | 1862
|
| Large Supply | 6266 | 6344 | 6405 | 6706 | 2.29% | 6706 | 6706
|
| Public Lighting | 76 | 91 | 89 | 104 | 10.84% | 115 | 127
|
| Bulk supply, MES & Traction | 390 | 394 | 418 | 455 | 5.27% | 479 | 504
|
| Common Pool | 51 | 113 | 105 | 381 | 95.56% | 381 | 381
|
| Outside State | 795 | 633 | 589 | 553 | -11.41% | 553 | 553
|
| Total Sales | 14,657 | 15,146 | 15,838 | 16,999 | 5.06% | 17,708 | 18,473
|
It will be seen from above that in the ARR and Tariff Application for the year 2005-06, the Board has projected aggregate metered sales at 18473 MU for the year 2005-06 of which metered sales within the state are 17539 MU. The Board has arrived at the category-wise sales to metered categories for 2004-05 (R.E) and 2005-06 (projections) based on 3-years CAGR for the years 2000-01 to 2003-04, except for large supply, common pool and sales to other states which are considered at
2003-04 levels.
The Board has stated that energy sales to large supply consumers are expected to be adversely affected due to Open access and Captive generation provisions of the Electricity Act, 2003. Already 5 No large industries (with contract demand of 161.52 MVA, annual energy consumption of 647 MU) have filed petition to the Commission for Open access/Captive consumption whereas a few new consumers would get added in the year 2005-06. Further, the Board has stated that it has conservatively projected sales to large supply consumers for the year 2005-06 at the level of actuals for the year 2003-04, taking into consideration the above aspect of shift of existing large supply consumers from the Board grid and also considering new consumer additions during the year.
The Commission considers that provisions of Open access and Captive generation may have some impact on the sales to large supply consumers during the year
2005-06 particularly in view of the pending petitions for Open access which are likely to be decided soon by the Commission. As such, the Commission decides to keep the sales to large supply consumers at the level of 6979 MU as approved in para 3.2.2, for the year 2004-05. For estimating sales to other metered categories within the state, the Commission has also considered CAGR for the last 3 years on the basis of actual sales. Category-wise sales within the state for the year 2005-06 have been estimated by applying 3 years CAGR on the sales now approved for the year 2004-05 in para 3.2.2. The actuals for the years 2000-01 and 2003-04, 3 year CAGR for 2000-01 to 2003-04, sales now approved for the year 2004-05 and estimated sales for the year 2005-06 for different metered categories within the state are given below in Table 7.2.
Table - 7.2
Three Year Cumulative Annual Growth & Estimated Metered Sales
within the State
| Sr.No | Category | 00-01 (Actuals) | 03-04(Actuals) | 3 year CAGR (00-01 to 03-04) (%) | Sales approved for 04-05 | Estimated sales for 05-06 by applying CAGR to 04-05 sales
|
|---|
| 1 | 2 | 3 | 4 | 5 | 6 | 7
|
| 1. | Domestic | 4261 | 5271 | 7.35 | 5150 | 5528
|
| 2. | Non-residential | 962 | 1299 | 10.53 | 1306 | 1444
|
| 3. | Small Power | 661 | 671 | 0.50 | 703 | 707
|
| 4. | Medium Supply | 1195 | 1559 | 9.27 | 1447 | 1581
|
| 5. | Large Supply | 6266 | 6706 | 2.29 | 6979 | 6979*
|
| 6. | Public Lighting | 76 | 104 | 11.02 | 111 | 123
|
| 7. | Bulk & Grid supply including Rly. Traction | 390 | 455 | 5.27 | 554 | 583
|
| 8. | Total within the State. | 13811 | 16065 | - | 16250 | 16945
|
* Considered at 2004-05 level.
These estimated metered energy sales within the State at 16945 MU for the year 2005-06 are approved by the Commission. The Commission approves sales to common pool at 381 MU and outside state sales at 360 MU as accepted by the Commission for the year 2004-05 at para 3.2.2.
The estimated metered sales for the year 2005-06 projected by the Board and as approved by the Commission are given below in Table 7.3.
Table - 7.3
Energy Sales 2005-06 (Metered)
| Sr.No | Category | Projected by the Board in ARR 05-06 | Approved by the Commission
|
|---|
| 1 | 2 | 3 | 4
|
| 1 | Domestic | 6075 | 5528
|
| 2 | Non-Residential | 1587 | 1444
|
| 3 | Small Power | 678 | 707
|
| 4 | Medium Supply | 1862 | 1581
|
| 5 | Large Supply | 6706 | 6979
|
| 6 | Public Lighting | 127 | 123
|
| 7 | Bulk & Grid Supply including Rly Traction | 504 | 583
|
| 8 | Total within the State | 17539 | 16945
|
| 9 | Sales to Common Pool | 381 | 381
|
| 10 | Outside State Sales | 553 | 360
|
| 11 | Total Metered Sales | 18473 | 17686
|
The Commission thus approves the metered sales at 17686 MU against 18473 MU projected by the Board for the year 2005-06.
7.1.3
Consumption by Agricultural Pumpsets
The Board in its ARR for the year 2005-06 has projected the consumption by agricultural pumpsets at 7364 MU @ 1814 kwh/kw/year on the agriculture sanctioned load and factoring in the consumption of lift irrigation tubewells, tubewells in Kandi area and PAU tubewell connections. The consumption norm of 1814 kwh/kw/year used by the Board for the year 2005-06, is assumed to be equal to the consumption norm indicated in the revised estimates for the year 2004-05. The revised estimates for the year 2004-05 are , in turn based on the actuals for the first half of 2004-05 and for the second half, on the basis of average of last three years ratios between the energy consumption for the first half and second half. Revised estimates for the year 2004-05 and the projections for the year 2005-06 are both based on sample meter readings. The Board has emphasized that there has been significant shift from monoblock pumpsets to submersible pumpsets over the past few years due to the drop in ground water levels resulting in higher electricity consumption for the same level of water output.
The Government in its comments on the ARR for the year 2005-06, has expressed the view that till there is credible method of measuring AP consumption, the Commission could continue assessing the AP consumption at 1650 kwh/kw/year. In the long run, however, it is imperative that this norm be fixed in a scientific and rational manner on the basis of reliable data. It has been suggested that notwithstanding any decision on the individual consumer metering issue, the Commission must emphasize the installation and reading of meters on the distribution transformers feeding agriculture pumpsets and allow the cost of such installation in the Tariff. Readings from the distribution transformer meters would be the most appropriate method of evaluating the AP consumption. Sample meter readings of agriculture pumpsets cannot be used as the sole method of evaluation.
Bhartiya Kisan Union has submitted that there should be 12 hours continuous power supply to agricultural consumers. PSEB Engineers’ Association has suggested that consumption by agricultural pumpsets may be assessed from monthly energy sent out on 11 KV tubewells feeders by deducting metered domestic consumption and 11 KV LT loss figure worked out theoretically.
The matter of estimating the energy consumption by agricultural pumpsets during the year 2002-03 and subsequent years was deliberated by the Commission in its Tariff Orders for the years 2002-03, 2003-04 and 2004-05. The Commission had fixed AP consumption norm of 1700 kwh/kw/year for the year 2002-03. While fixing this norm, the Commission had been conscious of the fact that the year 2002-03 was turning out to be a year of substantial monsoon failure necessitating higher energy consumption by the agricultural pumpsets, at least for the kharif crop and accordingly, a somewhat liberal norm of 1700 kwh/kw/year was fixed. Based entirely on the facts, figures and arguments advanced by the Board during the course of the Tariff Order for the year 2003-04 for enhancement of consumption in the year
2002-03 due to failure of monsoon in that year, the Commission decided to allow consumption norm of 1650 kwh/kw/year for a normal monsoon year. The norm of 1650 kwh/kw/year was adopted to assess AP consumption for the year 2003-04, it being a normal monsoon year.
During the course of the Tariff Order for the year 2004-05 (Tariff Order issued on November 30, 2004), the Commission observed that the year 2004-05 had turned out to be a year of substantial monsoon failure during the months of the kharif season and thus agricultural pumpsets required more power than in a normal year. Accordingly, the Commission had fixed the norm for AP consumption at 1700 kwh/kw/year for the year 2004-05 with the provision that the actual average AP consumption can be settled at the end of the year and after more authentic information is available.
The Commission in its first Tariff Order for the year 2002-03 had asked the Board to get a detailed, rational and scientific study done for assessment of AP consumption from an independent and reputed agency. With the approval of the Commission, the study was entrusted to Punjab Agricultural University (PAU). In its ARR for the year 2005-06, the Board has intimated that PAU has asked for time till July 31,2005 to submit its final report addressing various issues pertaining to AP consumption.
After considering various factors as discussed in para 3.2.3, the Commission has decided to assess the AP consumption / consumption norm for the year 2004-05 based on sample meter readings till the report of PAU addressing various issues pertaining to AP consumption is available and / or more reliable and scientific data is available.
In its ARR for the year 2005-06, the Board has projected AP consumption norm as 1814 kwh/kw/year for the years 2004-05 and 2005-06. As discussed in para 3.2.3 of this order relating to AP consumption for the revised ARR for the year 2004-05, the actual consumption norm for the year 2004-05 is estimated to be 1800 kwh/kw/year.
The Board submitted that during the year 2004-05, AP load to the tune of 660 MW has been regularized under voluntary disclosure scheme upto February, 2005. This regularized load represents load which hitherto had remained operative but
un-authorized and hidden and as such, the AP consumption norm during 2005-06 is likely to be lower than the estimated norm for the year 2004-05 as per sample meter readings. In view of this, the Commission is of the opinion that for assessing AP consumption for the year 2005-06, the AP consumption norm approach should not be followed. But we may continue with the approach now adopted for assessing consumption for the year 2004-05 as elaborated in para 3.2.3 of Chapter-3. The Commission has however, decided to allow reasonable increase on the AP consumption approved for the year 2004-05. The Commission considers that against AP consumption of 6563 MU approved for the year 2004-05, the AP consumption level of 7000 MU will be reasonable for the year 2005-06.
The Commission, thus, approves AP consumption for the year 2005-06 at the level of 7000 MU against AP consumption of 6563 MU approved for the year 2004-05.
The AP consumption for the year 2005-06 is, however, approved subject to the following conditions :-
The AP consumption approved will be settled at the end of the year based on sample meter readings and other relevant factors.
The AP consumption is broadly in line with the consumption pattern of previous years.
The Board will co-relate the results of energy audit of 11 KV feeders exclusively feeding the AP consumers with the results of sample meter readings.
As stated by the Board, the metering on LT side of all the distribution transformers supplying electricity to AP consumers may be completed by March 2006. In such case, consumption recorded by meters installed on distribution transformers may be compared with the consumption as per sample meter readings to ensure accuracy of the sample meter study.
PAU may be requested to submit its Final Report addressing various issues pertaining to agriculture consumption by July 31, 2005.
The Board will get the accuracy of all sample meters checked and take remedial action to get the same re-calibrated or replaced wherever required. A copy of reports on the matter may be forwarded to the Commission on quarterly basis.
During 2005-06, the supply hours to AP consumers will be maintained at the same level and on the same pattern both during rabi and kharif season as during the year 2004-05.
7.1.4
Total Energy Demand (Sales)
The category-wise sales as projected by the Board and as approved by the Commission are given in Table 7.4 below.
Table - 7.4
Total Energy Sales for 2005-06
| Sr.No | Category | Projected by the Board in ARR | Approved by the Commission
|
|---|
| 1 | 2 | 3 | 4
|
| 1. | Total metered sales within the state | 17539 | 16945
|
| 2. | Agriculture | 7364 | 7000
|
| 3. | Total sales within the state (1+2) | 24903 | 23945
|
| 4. | Sales to common pool | 381 | 381
|
| 5. | Outside state sales | 553 | 360
|
| 6. | Total Sales (3+4+5) | 25837 | 24686
|
The Commission thus approves the energy sales to various categories of consumers at 24686 MU including common pool and outside state sales against 25837 MU projected by the Board in the ARR for the year 2005-06.
7.2
TRANSMISSION AND DISTRIBUTION (T&D) LOSSES
The Board in its ARR filings for the year 2005-06 has projected T&D losses at 24.00% for the year 2005-06 with AP consumption at 7364 MU. The Board has brought out that T&D losses are determined by deducting the assessed/ estimated AP consumption from energy available within the state after meeting the energy sales to the metered categories. In the ARR, the Board has submitted that (a) energy availability proposed by the Board in the petition may not be reduced. If the Commission reduces the level of supply to the agricultural pumpsets proposed by the Board, then there should be a corresponding increase in T&D losses, (b) it is quite difficult to reduce losses by more than 0.5% p.a, due to low loss level base in Punjab. It requires significant effort and resources to reduce losses even by 0.5% due to law of diminishing returns and (c) due to the adverse impact of Open access and Captive generation provisions of the Act on HT sales, it is likely that the proportion of energy sales to LT consumers to the total energy would increase in 2005-06 and future years resulting in significant increase in the present T&D loss level of the Board. Further, in its presentation, the Board has submitted that from the assessed T&D losses of 27% for the year 2003-04, it is difficult to achieve the target T&D loss of 23.25% for the year 2004-05 and further reduction thereafter. The Board has also stated that there are precedents in other States where T&D loss target was reset with respect to lower AP consumption allowed by the SERCs.
The determination of T&D losses is vitally important not only for working out energy requirement but also for determining the ARR to be allowed to the Board. In fact T&D losses are perhaps the most important performance parameter for any power utility. Number of consumers have highlighted need for reducing the T&D losses of the Board to enhance power availability and bring down tariff to a reasonable level. Even 1% reduction in T&D losses translates to about Rs.100 crores reduction in the ARR of the Board and a reduction of about 4 paise per unit in tariff. The T&D losses also have a direct link with the AP consumption and thereby have major impact on the requirement of subsidy to be provided by the Government.
In the ‘Guidelines for Terms and Conditions of Distribution Tariffs’ finalized by the Forum of Indian Regulators (FOIR), it has been provided that the utility will have to share with the consumers, part of the financial gains arising from achieving higher T&D loss reduction vis -a -vis the target. Losses on account of under achievement of T&D loss reduction target will be entirely borne by the utility.
In the first year of tariff determination exercise i.e. for the year 2002-03 the Commission first undertook assessment of the existing T&D losses for the year
2001-02. The Commission made its own assessment of the AP consumption and recalibrated T&D losses for the year 2001-02. Taking this as base level, every year the Commission has been determining T&D loss targets to be achieved by the Board. The targets fixed by the Commission are well below the targets being fixed by the other State Commissions. This is clear from the fact that in the last three Tariff Orders of the Commission, targets for T&D loss reduction range between 1.02% to 2% only against the normal T&D loss reduction trajectory of around 2-4% each year fixed by other Commissions. The reasonability of the targets fixed by the Commission is also amply clear from the details given in the last Tariff Order of the Commission for the year 2004-05 in para 7.4.
In accordance with the above principles for fixing T&D loss target for the year
2002-03, the Commission redetermined the actual T&D loss level for the year
2001-02 at 27.52% with AP consumption arrived at with AP consumption norm of 1700 kwh/kw/year (i.e. the norm fixed for the year 2002-03) against actual loss of 26.25% indicated by the Board during the course of Tariff Order for the year 2002-03 and against 25.50% contemplated by the Board in the ARR for the year 2002-03 with their own figure of AP consumption. A reduction target of 2% was set by the Commission for the year 2002-03 with reference to the actual T&D loss level for the year 2001-02 redetermined by the Commission. The Commission had, thus, approved T&D losses of 25.52% for the year 2002-03 with AP consumption at 5235 MU arrived at with approved AP consumption norm of 1700 kwh/kw/year. This was against T&D loss of 24.50% projected by the Board in its ARR for the year 2002-03 with AP consumption at 5986 MU. For the year 2003-04, the Commission fixed the T&D loss target of 24.50% i.e. a reduction of only 1.02% over the target fixed for the year 2002-03. Further, the Commission in its Tariff Order for the year 2004-05 fixed the target for T&D loss of 23.25% for the year 2004-05, i.e. a reduction of 1.25% over the loss level fixed for the year 2003-04. The Commission also stated that it would continue to set this modest target of 1.25% for loss reduction in each of the next four years starting with 2004-05.
The Board has been emphasizing that it is unable to achieve the T&D loss target fixed by the Commission, mainly because while fixing the T&D loss target, the Commission has not been accepting AP consumption as per sample meter readings. Even if the plea of the Board is accepted and AP consumption is assessed exactly as per sample meter readings, the actual T&D loss level achieved by the Board for different years is as under :-
| Year | T&D losses with agriculture consumption as per sample meters
|
|---|
| 2002-03 | 24.54%
|
| 2003-04 | 25.35%
|
| 2004-05 | 24.14%
|
It is observed from the above that even after accepting the Board’s plea in total and assessing AP consumption as per sample meter readings, the Board has not been able to reduce T&D losses by even half a percent since the year 2002-03. In fact, the T&D losses for the year 2003-04 have increased as compared to the T&D losses during the year 2002-03. In the circumstances, the Board can definitely not claim to have performed well on this account.
In respect of T&D losses, the Expert Group set up by the State Government for steering power reforms, under the Chairmanship of Shri Gajendra Haldea has expressed its opinion as under :-
“The Orissa experience has clearly highlighted the need for a realistic measurement of the base level T&D losses of the system. As pointed out earlier, PSEB had been generally pegging the T&D losses at around 17-18% by showing the rest of the unaccounted supply as going to unmetered agriculture consumers. With greater transparency in tariff setting following the constitution of PERC, current estimates peg the T&D losses at around 27.5% and they include significant volumes of pilferage.
In physical terms, PSEB loses about 7,500 MUs which is equivalent to about 1,250 MW of generating capacity. This implies a revenue loss of about
Rs.2,400 crore per annum. In a well functioning system, these losses would be in the region of about 11-12%. Thus, there is potential for a saving about Rs.1,400 crore per annum. This could convert into a tariff reduction of over 60 paise per unit, though part of it would have to be set off for servicing the investments required for upgrading the network.
PSEB had petitioned PERC for an increase of about Rs.2,050 crore in its revenue for the year 2002-03 in order to break even on its continuing losses. PERC, however, granted a tariff increase of about Rs. 660 crore by disallowing some of the claims made by PSEB and by setting higher standards of operational efficiency. This implied an increase of about 15% over the tariff revenue for the previous year. Nevertheless, PSEB is likely to close the year 2002-03 with a deterioration of about Rs.1,050 crore compared to the revenue requirements assessed by PERC. As a result, stiff tariff increases seem inevitable for 2003-04. However, to the extent PERC does not admit the claims of PSEB, the losses would devolve on the State Government. In effect, the common man either in his capacity as the rate payer of PSEB or as a tax payer of Punjab will bear the burden.
Before PERC was set up, tariff fixation by political decision was regarded as the bane of the power sector. Indeed, PERC is expected to depoliticise the process of tariff setting. However, experience in several states has clearly shown that depoliticisation of tariff setting alone cannot solve all the problems. For example, the SERC in Orissa has fixed the tariffs by assuming T&D losses at a level of 35% against the reported losses of 46% resulting in huge commercial losses for the distribution companies that are driving the system to bankruptcy.
Since PERC has to determine tariffs in a transparent manner, it is only to be expected that it will not be inclined to pass on all the problems and inefficiencies of PSEB to the consumers by simply increasing the tariffs. PERC is, therefore, likely to fix tariffs by assuming some efficiency improvements, especially reduction in T&D losses, and if PSEB fails to measure up to these assumptions, it will continue to make losses.
One way of addressing loss reduction is to redefine T&D losses, by excluding therefrom the pilferage losses. Currently, the difference between the electricity purchased / generated and billed is treated as a T&D loss. It is necessary to benchmark the technical limit of T&D losses (i.e. losses technically inevitable in the process of transmission and distribution) and to deal with the rest as losses caused by pilferage.
As per present estimates, losses on account of pilferage are said to be about 9% while technical losses are projected as 18.5% of the electricity procured. Sample studies should be undertaken for validating these assumptions with a view to getting a better and a more accurate picture of working of PSEB. It should be relatively easy to determine the pace of reduction of purely technical losses as a function of investments in the distribution system. A view can be taken on how rapidly pilferage losses can be reduced through better enforcement.
The Group recognizes that it is difficult to determine the extent of loss reduction which PSEB and its successor entities should achieve. In the case of Orissa, these losses have declined only by about 1.5% per annum over the past five years. The Government of Delhi has anticipated a cumulative reduction of about 2% during the first two years of privatisation to be followed by a reduction of 15% in the next three years. On the other hand, it has been demonstrated that T&D losses can be restricted to about 11% as in the case of BSES and BEST in Mumbai, while losses of NDMC in Delhi are currently pegged at about 16%.
The Group is not in a position to pronounce on what should be the normative level of loss reduction but it is clear that acceptance of high levels of losses will only lead to high tariffs being paid by honest consumers. Clearly, a strategy for rapid reduction of these losses is essential, as the consumers will increasingly resist any tariff revisions that defend such large–scale thefts. As an objective of power reforms, it should be the endeavour of the State to reduce T&D losses by about 3% per annum so as to achieve a level of about 12.5% over a period of five years.
The Group noted the reservations of PSEB officials in setting a target of 12.5% for T&D losses. The group, however, believes that it is not an impossible task given several success stones elsewhere. For example, a company in Argentina reduced the losses from 25.6% to 8.1% in 6 years ; another company in the same country brought down losses from 30% to 18.05% in 3 years ; similarly, a company in Peru reduced the losses from 20% to 10.1% within four years ; and a company in Chile reduced the losses from 19.8% to 6% in 11 years. The Group believes that the target of 12.5% for Punjab is well worth pursuing.
The Group further believes that investment in creating generating capacity often pre-empts allocation of resources for transmission and distribution. The hype associated with setting up generating stations may be more exciting than the mundane task of setting distribution systems in order, but for the millions of consumers that is what will make the difference between reliable power supply and expensive yet erratic supply. For example saving of 1% in T&D losses converts into a financial saving of about Rs. 100 crore, which in turn can sustain an investment of about Rs. 500 crore. Upgrading the network would thus save physical and financial resources that would improve the efficiency and cost of supply to the consumer.”
It is thus seen that the report of the Expert Group constituted by the State Government recommended reduction in losses by about 3% per annum so as to achieve level of about 12.5% over a period of 5 years. This report of the Expert Group stands accepted by the Government in principle.
The Commission would like to reiterate that the State Government has already signed an MoU with the Government of India in March, 2001 for undertaking reforms in the power sector in Punjab and it was agreed in this MoU that the Board would bring the T&D losses to the level of 18% by the year 2003.
The State Government itself in its comments to the Commission on the ARR filings for the various years has been recommending a tight T&D loss level to be fixed for determination of the ARR. In its comments on the ARR for the year
2002-03, the State Government emphasized that T&D loss may be restricted to 22.50% for the year 2002-03. The next year, the Government in its comments expressed the view that tariff revision may not be the only instrument for meeting the ARR of the Board. Other measures such as reduction in costs, improving operating efficiencies and reduction in T&D losses also need to be considered. In its comments on the ARR for the year 2004-05, the State Government, however, intimated that it is agreeable to the proposal of the Board for allowing the projected losses of 24% for the year 2004-05. Further, the Government in its comments on the ARR for the year 2005-06 has expressed that though the desirability of bringing down T&D losses is beyond question but while determining the T&D loss trajectories, it is more appropriate to set the initial starting point at the actual levels instead of the desired levels. Therefore, it would not be realistic and fair to ask the Board to bring down its losses to 23.25% in 2004-05 and 22% in 2005-06 when its actual losses in 2003-04 were as high as 27% as worked out by the Commission in its Tariff Order for the year 2004-05 and has suggested that the Commission may revise the targets for reduction of T&D losses. These may need to be revisited when AP consumption is more authentically determined.
In this connection, it may be stated that the Commission has already determined targets for T&D losses taking into account the actual level of T&D losses in the Board in the year 2001-02. The target reduction of 1-2% per annum cannot be said to be unrealistic specially in view of the existing level of T&D losses. The State Government’s own views in earlier years as well as the Expert Committee Report and the MoU which the Government of Punjab has signed with the Government of India clearly substantiate this view. Further, the fact that T&D losses bear an inter-relationship with the amount of AP consumption can also not be used to justify non-achievement of T&D loss targets. This is in view of the fact that even with respect to AP consumption as per sample meter readings, there is no improvement in level of T&D losses since the year 2002-03 as brought out earlier. The power availability in the State has not been reduced by the Commission on account of the difference between targeted T&D losses and actual T&D losses. Rather, full availability of power has been ensured. Even in this year, full cost of power purchase will be allowed on actual basis at the end of the year. However, the Board needs to be penalized for non achievement of the targets of the important performance parameter. Else, there is no purpose in fixation of targets. Even levy of token penalty has no significance in view of the huge financial implications of non-achievement of target under this head. Recalibration of trajectory every year in the light of actual levels obtained also has no meaning as this would involve change in trajectory every year. No purpose is served by fixing such trajectories which will undergo change every year. Such a course of action leads to no comfort either to the prospective investor in power sector or to a consumer of electricity. Besides, such a course of action results in rewarding the defaulters and that to on an ongoing basis – by lowering of targets for them. As such, the Commission does not accept such an approach and has decided to go by the trajectory already drawn by the Commission in its Tariff Order for the year 2004-05.
All the legitimate revenue requirements of the Board including for investment are being fully met through the Tariff Orders of the Commission. Further, the AP consumption for the year 2005-06 has been allowed giving adequate increase over the AP consumption for the year 2004-05 which in turn has been accepted on the basis of estimates as per sample meter readings as discussed in para 3.2.3. In addition, on the basis of sales and energy availability now approved by the Commission the actual T&D losses for the year 2004-05 are 24.19% only as discussed in para 3.5. As such, the Commission finds no merit in the submissions made by the Board for its inability to achieve the reduction target of T&D losses set by the Commission. The Commission has, therefore, decided to fix the target for T&D losses at 22.00% for the year 2005-06 i.e. a reduction of 1.25% over the loss level fixed for the year 2004-05 as already indicated in its Tariff Order for the year 2004-05.
7.3
Energy Requirement (Input)
The total energy requirement to meet the demand of the system would be the sum of estimated energy sales including common pool and outside state sales and T&D losses. The estimated energy sales, the T&D losses and estimated energy
requirement as projected by the Board and as approved by the Commission for the year 2005-06 are given in Table 7.5.
Table - 7.5
Energy Requirement for 2005-06
| Sr.No | Particulars | As projected by the Board in ARR | As approved by the Commission
|
|---|
| 1 | 2 | 3 | 4
|
| 1. | Metered Sales within State | 17539 | 16945
|
| 2. | Agriculture consumption | 7364 | 7000
|
| 3. | Total sales within state (1+2) | 24903 | 23945
|
| 4. | Common pool sales | 381 | 381
|
| 5. | Outside state sales | 553 | 360
|
| 6. | Total sales | 25837 | 24686
|
| 7. | T&D losses on item (3) | (24%) 7864 | (22%) 6754
|
| 8. | Total energy input required | 33701 | 31440
|
The overall energy requirement projected by the Board and approved by the Commission differ by 2261 MU. This is due to difference in sales to metered categories as well as to AP consumers and in T&D losses projected by the Board and allowed by the Commission.
The energy requirement is thus 31440 MU and this has to be met from own generation of the Board (Thermal & Hydel) including share from BBMB and purchases from central generating stations and other sources.
7.4
OWN GENERATION OF THE BOARD
7.4.1
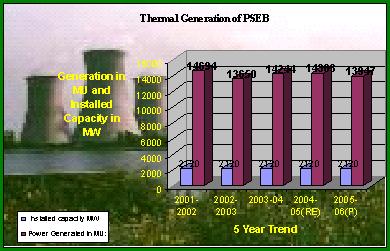
Thermal Generation
The Board in its ARR for the year 2005-06 has supplied actual generation figures for the year 2003-04, revised estimates for the year 2004-05 and projection for the year 2005-06 for its different thermal stations. These, alongwith the generation approved by the Commission for the year 2004-05 are given below in Table 7.6.
Table - 7.6
Gross Thermal Generation
| Sr.No | Station | Actuals for 03-04 | 2004-05 | PSEB projection for 05-06 in ARR 05-06
|
|---|
| Approved by the Commission in T.O 04-05 | RE by PSEB in ARR 05-06
|
|---|
| 1 | 2 | 3 | 4 | 5 | 6
|
| 1. | GNDTP | 2551 | 1982 | 2023 | 2100
|
| 2. | GGSTP | 8313* | 8895 | 9000 | 8650
|
| 3. | GHTP | 3380 | 3179 | 3197 | 3120
|
| | Total | 14244 | 14056 | 14220 | 13870
|
* On actual verification it has been found to be 8304 MU, Refer para 2.3.1.
The Board has submitted that unit-2 at GNDTP, Bathinda was shutdown for renovation & overhaul w.e.f. March 9, 2004 till April 30,2005, while unit-1 would be shut down for renovation & overhaul w.e.f. April 1,2005 till November 30,2005, and other units for annual overhaul. The combined outage of the generating units of 110MW each would be 334 machine days (8016 machine hours) during the year 2005-06.
The generating units 1, 2, 3, 4, 5 & 6 at GGSTP, Ropar are being taken out for statutory inspection of boiler, annual overhaul etc. for a total period of 165 machine days (3960 machine hours) during the year 2005-06.
The unit 1 & 2 at GHTP, Lehra Mohabbat are also being taken out for capital and annual maintenance for 60 machine days (1440 machine hours) during the year 2005-06.
The Board has also submitted that the thermal plants are strictly following the maintenance norms recommended by the manufacturer M/S BHEL and as per recommendations of Srinivasan/Kukde working group appointed by CEA.
Based on the maintenance schedules, the availability of GNDTP, GGSTP and GHTP in 2005-06 works out to be 77.12%, 92.47% and 91.78% respectively. Against this, the Board has indicated that availability for GNDTP will be 71.12% while availability for GGSTP and GHTP will be in the range of 89-90%. The difference in availability worked out from maintenance schedules and that indicated by the Board is because the Board has considered the forced outage also while estimating the availability of the plants.
The Commission has considered the details of maintenance carried out, the duration of maintenance and generation for each of the stations for the last three years(i.e 2001-02,2002-03 and 2003-04 ) and the availability of the station as worked out from the maintenance schedules during the year 2005-06 for assessment of the generation at different thermal generating stations during the year 2005-06. These are given below in Table 7.7.
Table - 7.7
Availability, Generation and Plant Load Factor of Thermal Plants
| Sr.No | Station | Three year average availability (%) | Three year average generation (MU) | Assessed by the Commission for the year 05-06
|
|---|
| Availability (%) | Generation
4x5
3
(MU) | PLF (Calculated) (%)
|
|---|
| 1 | 2 | 3 | 4 | 5 | 6 | 7
|
| 1. | GNDTP | 90.49 | 2605 | 77.12 | 2220 | 57.60
|
| 2. | GGSTP | 90.65 | 8468 | 92.47 | 8638 | 78.26
|
| 3. | GHTP | 92.70 | 3120 | 91.78 | 3089 | 83.96
|
The Commission approves the thermal generation as assessed in Table 7.7 above, for each of the stations. The generation projected by the Board and as approved by the Commission for the year 2005-06 at different thermal stations is given below in
Table 7.8
Table - 7.8
Gross Thermal Generation for 2005-06
| Sr.No | Station | Projected by the Board in ARR 05-06 | Approved by the Commission
|
|---|
| 1 | 2 | 3 | 4
|
| 1. | GNDTP | 2100 | 2220
|
| 2. | GGSTP | 8650 | 8638
|
| 3. | GHTP | 3120 | 3089
|
| | Total | 13870 | 13947
|
Auxiliary Consumption & Net Generation.
The actual auxiliary consumption during the year 2003-04 is 9.54%, 8.33% and 8.91% for GNDTP,GGSTP and GHTP respectively. In ARR for the year 2004-05, the auxiliary consumption levels projected by the Board for the year 2004-05 were 11%, 9.34% and 9.61% for GNDTP,GGSTP and GHTP respectively. Against this, the Commission allowed auxiliary consumption at the levels actually obtained during 2003-04 being comparable with the CERC norms for auxiliary consumption.
For the year 2005-06, the auxiliary consumption projected by the Board for GNDTP, GGSTP and GHTP is 12.40%, 9.34% and 9.60% respectively.
The Board has submitted that the projected auxiliary consumption includes excitation and step-up transformation losses of around 0.5% incurred to step-up the electricity generated to the transmission voltage, which has not been considered in the past years. It has also been submitted that even though the auxiliary consumption of PSEB stations is slightly higher than CERC norms for normal thermal stations, but it is much lower than the CERC norms for similarly aged Tanda and Talcher stations. Further, it has been submitted that auxiliary consumption is specific to a particular plant depending on the kind of the auxiliary equipments installed at the plant and the percentage of auxiliary consumption varies depending on the total generation. Further, the Board has stated that nothing much can be done to reduce the auxiliary consumption unless major R&M is carried out.
CERC, vide its notification No.L-7/25(5)2003-CERC dated 26.3.2004 has made regulations for determining terms and conditions for electricity tariff for the five year period beginning April 1, 2004. In these regulations, CERC has laid down norms of auxiliary consumption for coal-based thermal power generating stations as given below in Table 7.9.
Table -7.9
CERC Norms for Auxiliary Consumption
| | | With cooling tower | Without cooling tower
|
|---|
| 1 | 2 | 3 | 4
|
| i) | 200 MW series | 9.0% | 8.5%
|
| ii) | 500 MW series
Steam driven boiler feed pumps.
Electrically driven boiler feed pumps |
7.5%
9.0% |
7.0%
8.5%
|
| iii) | Talcher Thermal Power Station | 11.0% |
|
| iv) | Tanda Thermal Power Station | 11.0% |
|
At GGSTP, 6 units of 210 MW capacity each have been installed and no cooling towers have been provided. At GHTP, 2 units of 210 MW capacity each with cooling towers have been installed. At GNDTP, 4 units of 110 MW capacity each with cooling towers have been installed. CERC has not fixed any norm of auxiliary consumption for units of the series installed at GNDTP.
For the year 2005-06, the Commission has decided to adopt CERC norms for auxiliary consumption. The CERC norm of auxiliary consumption applicable for GGSTP is 8.50% and for GHTP it is 9.00%. The Commission, thus, allows auxiliary consumption level for GGSTP and GHTP at 8.50% and 9.00% respectively. CERC has not specified any norm for units installed at GNDTP but has specified norm of 11.00% for Tanda station of NTPC which like GNDTP, is having 4 units of 110 MW each, commissioned between 1987-88 and 1997-98 i.e. later than the commissioning of GNDTP units which were commissioned between 1974-75 and 1979-80. The Commission, thus, allows auxiliary consumption for GNDTP at 11.00% against 12.40% projected by the Board for the year 2005-06.
The auxiliary consumption and net generation from the three thermal generating stations as projected by the Board and that approved by the Commission for the year 2005-06 is given in Table 7.10 below.
Table - 7.10
Generation and Auxiliary Consumption for 2005-06 for Thermal Plants
| Sr. No | Plant | Projected by the Board ARR 05-06 | Approved by the Commission
|
|---|
| Gross Generation | Auxiliary Consumption | Net Generation | Gross Generation | Auxiliary Consumption | Net Generation
|
|---|
| 1 | 2 | 3 | 4 | 5 | 6 | 7 | 8
|
| 1. | GNDTP | 2100 | 260
(12.40%) | 1840 | 2220 | 244
(11.00%) | 1976
|
| 2. | GGSTP | 8650 | 808
(9.34%) | 7842 | 8638 | 734
(8.50%) | 7904
|
| 3. | GHTP | 3120 | 300
(9.60%) | 2820 | 3089 | 278
(9.00%) | 2811
|
| | Total | 13870 | 1368 | 12502 | 13947 | 1256 | 12691
|
The net thermal generation thus approved by the Commission is 12691 MU against 12502 MU projected by the Board for the year 2005-06.
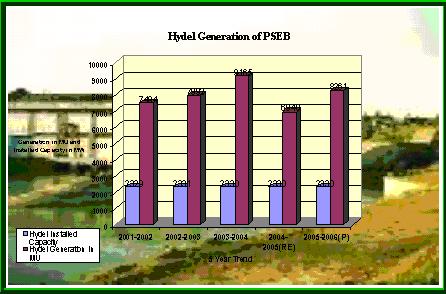
7.4.2
Hydel Generation
In the ARR for the year 2005-06, the Board has supplied actual hydel generation for the year 2003-04, revised estimates for the year 2004-05 and projections for the year 2005-06. These alongwith the hydel generation approved by the Commission for the year 2004-05 are given below in Table 7.11.
Table - 7.11
Gross Hydel Generation
| Sr.No | Station | Actuals for 03-04 | 2004-05 | PSEB projection for 05-06 in ARR 05-06
|
|---|
| Approved by the Commission in T.O 04-05 | RE by PSEB in ARR 05-06
|
|---|
| 1 | 2 | 3 | 4 | 5 | 6
|
| 1. | Shanan | 564 | 434 | 460 | 460
|
| 2. | UBDC | 427 | 328 | 380 | 380
|
| 3. | RSD | 1548 | 1190 | 1020 | 1020
|
| 4. | MHP | 1029 | 791 | 830 | 830
|
| 5. | ASHP | 829 | 628 | 528 | 528
|
| 6. | Micro Hydel | 10 | 8 | 10 | 10
|
| 7. | Total own Hydro Gross | 4407 | 3379 | 3228 | 3228
|
| 8. | *Share from BBMB including 381MU share of Common pool consumers | 4911 | 3469 | 3743 | 3743
|
*Share from BBMB is net available to PSEB after excluding NREB losses.
The Board has submitted that energy availability for the year 2004-05 is much lower than for the year 2003-04, mainly due to poor monsoon & snow capping (40% of normal snow capping) in the year 2004-05. For the year 2005-06, the Board has considered availability as per revised estimates for the year 2004-05, as the monsoon and snow capping cannot be predicted for the year 2005-06. Further, it has been submitted that net generation expected from BBMB during the year 2005-06 has been considered at the level indicated by BBMB for the year 2004-05.
For estimating hydel generation for the year 2005-06, the Commission has considered the average generation for three years. The recent three-year average needs to be considered as it gives more reliable generation figures for the year
2005-06. However, the actual hydel generation for different plants for the year
2004-05 is not yet available and as such generation for the years 2001-02, 2002-03 and 2003-04 has been considered. The projected generation by the Board and generation approved by the Commission on the basis of three-year average are given below in Table 7.12.
Table - 7.12
Hydel Generation for 2005-06
| Sr.No | Station | Generation projected by the Board in ARR 05-06 | Actual Generation | Generation approved by the Commission (Based on 3 year average for 01-02 to 03-04)
| | 01-02 | 02-03 | 03-04
|
|---|
| 1 | 2 | 3 | 4 | 5 | 6 | 7
|
|---|
| 1. | Shanan | 460 | 473 | 469 | 564 | 502
|
|---|
| 2. | UBDC | 380 | 320 | 394 | 427 | 380
|
|---|
| 3. | RSD | 1020 | 1229 | 1151 | 1548 | 1309
|
|---|
| 4. | MHP | 830 | 1167 | 795 | 1029 | 997
|
|---|
| 5. | ASHP | 528 | 510 | 750 | 829 | 696
|
|---|
| 6. | Micro Hydel | 10 | 10 | 9 | 10 | 10
|
|---|
| 7. | Total own generation (Gross) | 3228 | 3709 | 3568 | 4407 | 3894
|
|---|
| 8. | Total own generation (Net) | 3205* | -- | 3449 | 4254 | 3754**
|
|---|
| 9. | Net share from BBMB | | | | |
|
|---|
| a) | PSEB share | 3362 | 3673 | 4175 | 4530 | 4126
|
|---|
| b) | Common pool share | 381 | 336 | 368 | 381 | 381***
|
|---|
| c) | Total | 3743 | 4009 | 4543 | 4911 | 4507
|
|---|
| 10. | Total Hydel Generation (Net) | 6948 | -- | 7992 | 9165 | 8261
|
|---|
* Net of auxiliary consumption (7MU) and transformation losses (16MU)
** Net of HP royalty in Shanan (53 MU), HP share (free) in RSD @ 4.6% (60 MU), auxiliary consumption @ 0.2% (8MU) and transformation losses @ 0.5%(19MU) as per CERC Norms.
*** Refer para 7.1.2.
The Commission, thus, approves net hydel generation of 8261 MU for the year 2005-06 against 6948 MU projected by the Board in ARR for the year 2005-06.
7.4.3
Total Availability from own Stations of the Board and BBMB
The net generation from own Thermal and Hydel stations of the Board and share from BBMB would be as given below in Table 7.13.
Table - 7.13
Net Generation for 2005-06
| Sr.No | Source | Energy available (ex-bus)
|
|---|
| 1 | 2 | 3
|
| 1. | Thermal Stations | 12691
|
| 2. | Hydel Stations (Own) | 3754
|
| 3. | Share from BBMB (including 381 MU share of common pool consumers) | 4507
|
| 4. | Total own Availability | 20952
|
The total energy available (ex-bus) from own generating stations of the Board including share from BBMB approved by the Commission would be 20952 MU.
The position of thermal and hydel generation of the Board for last 5 years alongwith installed capacity is also given in the graphs opposite.
7.5
PURCHASE OF POWER
The total energy required (input to the system) to meet the demand of the State during 2005-06 including common pool and outside state sales is 31440 MU as discussed in para 7.3. The energy available from own generating stations of the Board including its share from BBMB is 20952 MU as approved in para 7.4. The balance requirement of 10488 MU (net) has to be met through purchases from central generating stations and other sources. This is against requirement of 14251 MU (net) projected by the Board in its ARR for the year 2005-06.
7.6
ENERGY BALANCE
To sum up the energy balance i.e. the approved energy sales to various categories of consumers, T&D losses, energy requirement and energy available would be as given in Table 7.14 below.
GENERATION SCENARIO
GROWTH IN CONSUMER BASE AND ENERGY AVAILABILITY
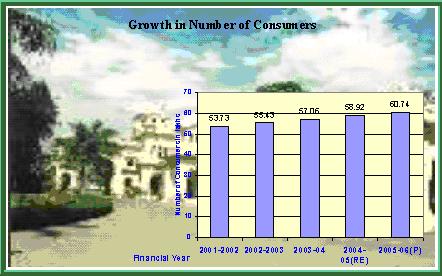
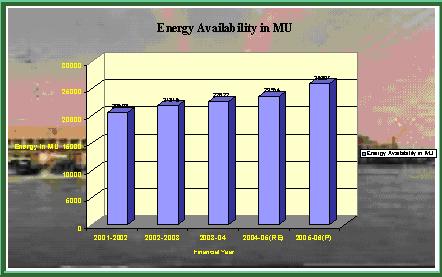 Table - 7.14
Energy Balance for 2005-06
| Sr.No. | Particulars | Projected by the Board in ARR 05-06 | Approved by the Commission
|
|---|
| 1 | 2 | 3 | 4
|
| A. | Energy Requirement | |
|
| 1. | Metered Sales within state. | 17539 | 16945
|
| 2. | Sales to Agriculture. | 7364 | 7000
|
| 3. | Total sales within state. | 24903 | 23945
|
| 4. | T&D Losses | 7864(24%) | 6754(22%)
|
| 5. | Common pool | 381 | 381
|
| 6. | Outside state sales | 553 | 360
|
| 7. | Total Requirement | 33701 | 31440
|
| B. | Energy Availability | |
|
| 1. | Own generation (ex-bus) | |
|
| a) | Thermal | 12502 | 12691
|
| b) | Hydro | 3205 | 3754
|
| 2. | Share from BBMB (including 381 MU share of common pool consumers) | 3743 | 4507
|
| 3. | Purchase (Net) | 14251 | 10488
|
| 4. | Total Availability | 33701 | 31440
|
The position of energy availability in the State over last 5 years viz-a-viz growth in number of consumers is given in the graphs opposite.
B
EXPENSES
7.7
Fuel Cost
i) Fuel Cost Projected by the Board
In the ARR, the Board has projected the fuel cost at Rs.2334.05 crores for a total generation of 13870 MU during the year 2005-06 as detailed below in Table 7.15
Table - 7.15
Fuel Costs projected by the Board for 2005-06
| Sr.No | Station | Gross Generation
(MU) | Cost of Fuel (Coal & Oil )
(Rs.crores)
|
|---|
| 1 | 2 | 3 | 4
|
| 1. | GNDTP | 2100 | 347.84
|
| 2. | GGSTP | 8650 | 1424.69
|
| 3. | GHTP | 3120 | 561.52
|
| | Total | 13870 | 2334.05
|
The Board has submitted that as per directives from the Government of India, the Board proposes to import 7.2 lakh tonnes of coal during 2005-06 to be utilized at GGSTP (3.2 lakh tonnes) and GHTP (4 lakh tonnes). The additional impact on cost of coal has been given at Rs.81.33 crores and Rs. 101.67 crores for GGSTP and GHTP respectively. The projected cost of fuel is inclusive of this impact. In this regard, copy of letter dated November 17, 2004 from the Government of India is also supplied in the ARR in which it is mentioned that the Board was agreeable to import coal to the tune of 7.2 lakh tonnes.
The Board has arrived at the above fuel costs based on the following parameters.
| Sr.No | Station | PLF(%) | Heat Rate (kcal/kwh) | Transit loss of coal (%) | Coal cost including transit loss (Rs/MT) | Calofic value of coal (kcal/kg) | Cost of Oil (Rs/KL) | Specific oil consumption (ml/kwh) | Calorific Value of oil (kcal/litre)
|
|---|
| 1 | 2 | 3 | 4 | 5 | 6 | 7 | 8 | 9 | 10
|
| 1. | GNDTP | 54.48 | 2770 | 3.00 | 2321 | 3910 | 14000 | 1.54 | 10000
|
| 2. | GGSTP | 78.37 | 2557 | 2.00 | 2307 | 3825 | 14000 | 1.35 | 10000
|
| 3. | GHTP | 84.80 | 2427 | 4.25 | 2449 | 4040 | 14000 | 0.32 | 10000
|
The Board has submitted that the performance parameters and coal transit loss of all the three stations as submitted by the Board may be approved without any disallowance considering the following:-
PSEB stations are vintage in nature, which naturally results in deterioration of performance over the years, inspite of regular maintenance, renovation & overhauls.
Performance of units of GNDTP and some units of GGSTP should be compared with CERC norms fixed for similar aged Tanda and Talcher stations, instead of CERC norms for new stations.
PSEB stations are fully depreciated with minimal capital cost being recovered from consumers, as against new stations and IPPs, whose fixed costs are relatively quite high in comparison to low cost stations of the Board. Thus, the unit cost of power generated by these stations are quite cheaper than new thermal stations.
PSEB stations are more efficient than CERC norms on PLF, specific oil consumption and station heat rate, for which these stations don’t get performance incentive presently.
The Board does not have much control in reducing coal transit loss beyond certain level as the reasons why they occur are due to other entities in the transaction viz Coal India and Indian Railways. Both these entities are monopolies and have not been willing to consider commercially feasible solutions.
ii) Fuel Cost approved by the Commission
Gross Generation
The gross generation of the thermal plants for the year 2005-06 has been discussed in para 7.4.1 and has been summarized in Table 7.8. The approved gross generation for the year 2005-06 is 2220 MU, 8638 MU and 3089 MU for GNDTP,GGSTP and GHTP respectively.
CERC Norms
CERC vide its notification No. L-7/25(5)/2003-CERC dated 26.3.2004 has made regulations for determining terms and conditions for electricity tariff for the five year period beginning April 1, 2004. In these regulations, CERC has laid down norms of operation for thermal plants. The Commission has decided to follow the CERC norms wherever specified.
Station Heat Rate
CERC, vide its notification No, L-7/25(5)/2003-CERC dated 26-3-2004 has made regulations for determining terms and conditions for electricity tariff for the five year period beginning April I, 2004. In these regulations, CERC has laid down norms of Gross Station Heat Rate for coal based thermal power generating stations as given below in Table 7.16.
Table - 7.16
CERC Norms for Gross Station Heat Rate
| Sr. No. | Unit size / Plant | SHR during stabilization period (kcal/kwh) | SHR subsequent to stabilization period (kcal/kwh)
|
|---|
| 1 | 2 | 3 | 4
|
| 1. | 200/210/250 MW sets | 2600 | 2500
|
| 2. | 500 MW and above sets | 2500 | 2450
|
| 3. | Talcher Thermal Power Station | | 3100
|
| 4. | Tanda Thermal Power Station | | 3000
|
Note: -
- In respect of 500 MW and above units where the boiler feed pumps are electrically
operated, the gross station heat shall be 40 kcal/kwh lower than the station heat rate indicated above.
- For generating stations having combination, of 200/210/250 MW sets and 500 MW and above sets, the normative gross station heat rate shall be the weighted average station heat rate.
At GGSTP and GHTP units of 210 MW have been installed for which CERC norms for SHR is 2500 kcal/kwh. At GNDTP, 4 units of 110 MW capacity each have been installed and CERC has not fixed any norm of SHR for these units.
The position of station heat rate for different thermal stations is given in Table 7.17.
Table - 7.17
Station Heat Rate of PSEB Thermal Stations
| Sr.No | Station | Station Heat Rate (kcal/kwh)
|
|---|
| CERC Norms | Actuals | Approved | As per ARR 05-06
|
|---|
| 02-03 | 03-04 | 02-03 | 03-04 | 04-05 | R.E. 04-05 | Projection05-06
|
|---|
| 1 | 2 | 3 | 4 | 5 | 6 | 7 | 8 | 9 | 10
|
| 1. | GNDTP | _ | 2865 | 2838 | 2884 | 2884 | 2837 | 2979 | 2770
|
| 2. | GGSTP | 2500 | 2581 | 2556 | 2500 | 2500 | 2500 | 2555 | 2557
|
| 3. | GHTP | 2500 | 2444 | 2401 | 2500 | 2500 | 2402 | 2410 | 2427
|
The station heat rate (SHR) of the three thermal generating stations was first discussed in detail in the Tariff Order for the year 2002-03. After detailed examination of heat rates of central generating stations and other stations of similar vintage, the Commission approved SHR for the year 2002-03 at 2884 kcal/kwh, 2500 kcal/kwh and 2500 kcal/kwh for GNDTP, GGSTP and GHTP respectively. For the year 2003-04, the Commission approved SHR at 2002-03 approved levels. For the year 2004-05, the Commission approved SHR at 2837 kcal/kwh and 2402 kcal/kwh for GNDTP and GHTP respectively which were at the pre-actual values for the year 2003-04 as then intimated by the Board and were less than the approved levels for these stations for the year 2003-04. For GGSTP, the Commission approved SHR at 2500 kcal/kwh which was at the level approved for the year 2003-04 and was lower than the pre-actual value for the year 2003-04.
For the year 2005-06, the Commission has decided to adopt CERC norms for SHR. The Commission, thus, approves SHR at 2500 kcal/kwh for GGSTP and GHTP. For GNDTP, the actual SHR for the year 2003-04 is 2838 kcal/kwh and CERC has not laid any norms of SHR for units of 110 MW installed at GNDTP. However, in view of the renovation and modernization of units at GNDTP, the Board has projected SHR at 2770 kcal/kwh for GNDTP for the year 2005-06 and the Commission approves the same.
Coal Transit Loss
“CERC, vide its notification No. L-7/25(5)2003-CERC dated 26.3.2004 has made regulations for determining terms and conditions for electricity tariff for the five year period beginning April 1, 2004. In these regulations, CERC has laid down norms for transit and handling losses as percentage of the quantity of coal dispatched by the coal supply company. These are as given below.
| Pit head generating stations | 0.3%
|
| Non-pit head generating stations | 0.8%
|
The Commission has dealt the issue relating to transit loss of coal in its Tariff Orders for the years 2002-03, 2003-04 and 2004-05. In the ARR for the year 2005-06, the Board has intimated that the transit loss actually obtained during 2003-04 is 6.08%,1.61% and 2.72% for GNDTP,GGSTP and GHTP respectively, whereas, the same were found to be 2.99%, 1.38% and 2.72% respectively on verification from the plants during the course of the Tariff Order for the year 2004-05. Taking into consideration the transit loss actually obtained during 2003-04 and CERC norms for coal transit loss for non pit head generating stations at 0.8%, the Commission in its tariff order for the year 2004-05, approved a transit loss of 2% for all the stations for the year 2004-05 which was an overall reduction of 1% over the level allowed for the year 2003-04. Further, the Board was directed to bring the transit loss to 1% in next three years with yearly reduction target of 0.33%. However, for the year 2005-06, the Commission has decided to adopt CERC norms for coal transit loss also as decided in the case of auxiliary consumption and station heat rate earlier in the chapter. The Commission, thus, approves a transit loss of 0.8% for all the three stations for the year 2005-06.
Price and Calorific Value of Coal
Price
The weighted average price of coal for the year 2003-04 was verified during the course of the Tariff Order for the year 2004-05. Keeping in view the revision of pit head price of coal by Coal India Limited w.e.f June 16, 2004, the Commission in its Tariff Order for the year 2004-05 allowed an increase of 9% in the cost of coal including freight charges and taxes, levies etc. Further, in view of revision of railway freight of coal w.e.f. November 27, 2004, the Commission has allowed increase in coal price while working out fuel cost for the revised ARR for the year 2004-05 at para 3.7. Considering the above, the updated price of coal for the year 2005-06 will be as given below in Table 7.18.
Table - 7.18
Price of Coal
(Rs./MT)
| Sr.No. | Station | Actuals for 03-04 as verified during the course of T.O. 04-05 | Increase w.e.f. June 16, 2004 @ 9% | Increase w.e.f. Nov 27, 2004 | Updated Price of Coal for 05-06
|
|---|
| 1 | 2 | 3 | 4 | 5 | 6
|
| 1. | GNDTP | 2181 | 196.29 | 84.93 | 2462.22
|
| 2. | GGSTP | 2023 | 182.07 | 85.00 | 2290.07
|
| 3. | GHTP | 2133 | 191.97 | 88.25 | 2413.22
|
The Commission, thus, adopts price of coal for the year 2005-06 as Rs. 2462/MT, Rs.2290/MT and Rs.2413/MT for GNDTP,GGSTP and GHTP respectively.
Calorific Value
As the updated price of coal for 2005-06 has been arrived at from the actual price of coal for the year 2003-04 by adding subsequent increases in price of coal, the Commission has considered the corresponding actual calorific value of coal for the year 2003-04. The weighted average calorific value of coal for the year 2003-04 was also verified during the course of the Tariff Order for the year 2004-05 and was found to be 3935 kcal/kg, 3825 kcal/kg and 4058 kcal/kg for GNDTP,GGSTP and GHTP respectively.
Specific Oil Consumption, Calorific Value & Price of Oil
CERC vide its notification No. L-7/25(5)2003-CERC dated 26.3.2004 has made regulations for determining terms and conditions for electricity tariff for the five year period beginning April 1, 2004. In these regulations, CERC has laid norms of secondary Fuel Oil consumption for coal based generating stations as given below :-
| | | During stabilization period | Subsequent period
|
|---|
| i) | All coal based thermal power generating stations except those covered under sub-clauses (ii) and (iii) below. | 4.5 ml/kwh | 2.0 ml / kwh
|
| ii) | Talcher thermal power station. | | 3.5 ml/kwh
|
| iii) | Tanda thermal power station. | | 3.5 ml/kwh
|
Commission in its Tariff Order for the year 2004-05 approved specific oil consumption for the three plants as 1.65 ml/kwh, 0.91 ml/kwh and 0.32 ml/kwh for GNDTP,GGSTP and GHTP respectively for the year 2004-05. These were as per specific oil consumption actually obtained during the year 2003-04. The projected levels of specific oil consumption for the year 2005-06 are 1.54 ml/kwh, 1.35 ml/kwh and 0.32 ml/kwh respectively. As in the case of other performance parameters of thermal stations, the Commission has decided to adopt CERC norms for oil consumption for the year 2005-06. The Commission, thus, approves oil consumption of 2.0 ml/kwh for all the three stations for the year 2005-06. The Commission approves the calorific value of oil and oil price as projected by the Board in the ARR for the year 2005-06.
Based on the generation and operational parameters, approved by the Commission above, the cost of fuel for the year 2005-06 works out to Rs.2176.19 crores as detailed below in Table 7.19.
Table - 7.19
Fuel Costs (Coal & Oil) for 2005-06.
| Sr. No | Item | Derivation | Units | Approved for 2005-06 | Total
|
|---|
| GNDTP | GGSTP | GHTP
|
|---|
| 1 | 2 | 3 | 4 | 5 | 6 | 7 | 8
|
| 1. | Generation | A | MU | 2220 | 8638 | 3089 | 13947
|
| 2. | Heat Rate | B | kcal/kwh Generated | 2770 | 2500 | 2500 |
|
| 3. | Specific oil consumption | C | Milli litre/kwh | 2.00 | 2.00 | 2.00 |
|
| 4. | Calorific value of oil | D | kcal/litre | 10000 | 10000 | 10000 |
|
| 5. | Calorific value of coal | E | kcal/kg | 3935 | 3825 | 4058 |
|
| 6. | Overall heat | F=(A*B) | G.cal | 6149400 | 21595000 | 7722500 |
|
| 7. | Heat from oil | G=(A*C*D)/1000 | G.cal | 44400 | 172760 | 61780 |
|
| 8. | Heat from coal | H=(F-G) | G.cal | 6105000 | 21422240 | 7660720 |
|
| 9. | Oil consumption | I=G*1000/D=A*C | KL | 4440 | 17276 | 6178 |
|
| 10. | Transit loss of coal | T | (%) | 0.8 | 0.8 | 0.8 |
|
| 11. | Coal consumption including transit loss | J=(H*1000/E)/(I-T/100) | MT | 1563973 | 5645752 | 1903031 |
|
| 12. | Cost of oil per KL. | K | Rs./KL | 14000 | 14000 | 14000 |
|
| 13. | Cost coal per MT | L | Rs./MT | 2462 | 2290 | 2413 |
|
| 14. | Total cost of oil | M=K*I/10**7 | Rs.crores | 6.22 | 24.19 | 8.65 | 39.06
|
| 15. | Total cost of coal | N=J*L/10**7 | Rs.crores | 385.05 | 1292.88 | 459.20 | 2137.13
|
| 16. | Total fuel cost | O=M+N | Rs.crores | 391.27 | 1317.07 | 467.85 | 2176.19
|
Any change in the price of coal and/or railway freight and oil indicated above, would be passed on to the consumers as Fuel Cost Adjustment.
The Commission approves the Fuel Cost at Rs.2176.19 crores for generation of 13947 MU against Rs. 2334.05 crores projected by the Board for generation of 13870 MU.
The Board has stated that it proposes to import 7.2 lakh tonnes of coal during 2005-06 with additional impact on cost of coal to the tune of Rs. 183 crores. In this regard, the National Electricity Policy issued by the Central Government under section 3 of the Electricity Act, 2003 provides that imported coal based thermal stations, particularly at coastal locations, would be encouraged based on their economic viability. As the Board has not given economic viability of the proposed import of coal, the Commission has not considered the additional impact on cost of coal on account of the proposed import of coal.
Fuel Cost Adjustment (FCA) Formula
Any change in the fuel cost from the level approved by the Commission would be passed on to the consumers as FCA. Punjab State Electricity Regulatory Commission (Conduct of Business) Regulations, 2005 published in the Government of Punjab Gazette on April 22, 2005 contain the FCA formula according to which any change in fuel cost would be passed on to the consumers with prior approval of the Commission.
7.8 POWER PURCHASE
7.8.1 Projection by the Board.
The Board in its ARR for the year 2005-06, has projected the power purchase cost at Rs. 3553 crores for purchase of 14849 MU for the year 2005-06.
The source-wise details of power purchase as approved by the Commission for the year 2004-05, revised estimates as supplied by the Board for the year 2004-05 and as projected by the Board for the year 2005-06 are given below in Table 7.20.
Table - 7.20.
Power Purchase Cost 2004-05 and 2005-06
| Sr. No | Source | As approved by the PSERC for 04-05 | Revised estimates for 04-05 By PSEB in ARR 05-06 | Projections for 05-06 in ARR 05-06
|
|---|
| Power Purchases (MU) | Cost (Rs.crores) | Average Rate (Rs./kwh) | Power Purchases (MU) | Cost (Rs.crores) | Average Rate (Rs./kwh) | Power Purchases (MU) | Cost (Rs.crores) | Average Rate (Rs./kwh)
|
|---|
| 1 | 2 | 3 | 4 | 5 | 6 | 7 | 8 | 9 | 10 | 11
|
| A | NTPC
|
| 1. | Anta | 345 | 58.19 | 1.69 | 337 | 59 | 1.77 | 367 | 65 | 1.77
|
| 2. | Auraiya | 568 | 98.04 | 1.73 | 578 | 121 | 2.08 | 608 | 127 | 2.09
|
| 3. | Dadri Gas | 849 | 148.58 | 1.75 | 842 | 180 | 2.14 | 947 | 203 | 2.14
|
| 4. | Singrauli | 1593 | 158.94 | 1.00 | 1538 | 186 | 1.21 | 1516 | 183 | 1.21
|
| 5. | Rihand | 849 | 122.97 | 1.45 | 874 | 145 | 1.66 | 828 | 137 | 1.66
|
| 6. | Unchahar-I | 262 | 46.29 | 1.77 | 259 | 49 | 1.90 | 260 | 49 | 1.90
|
| 7. | Uncha-harII | 446 | 75.55 | 1.69 | 441 | 86 | 1.95 | 445 | 87 | 1.95
|
| B | NHPC
|
| 1. | Salal | 840 | 50.81 | 0.60 | 820 | 61 | 0.75 | 825 | 61 | 0.74
|
| 2. | Baira-suil | 296 | 22.41 | 0.76 | 237 | 27 | 1.13 | 302 | 32 | 1.04
|
| 3. | Tanakpur | 80 | 9.09 | 1.14 | 69 | 9 | 1.31 | 65 | 9 | 1.36
|
| 4. | Chamera-I | 224 | 29.20 | 1.30 | 175 | 26 | 1.50 | 215 | 37 | 1.74
|
| 5. | Chamera-II | 505 | 123.73 | 2.45 | 401 | 91 | 2.28 | 187 | 43 | 2.27
|
| 6. | Uri | 337 | 81.85 | 2.43 | 307 | 79 | 2.57 | 334 | 79 | 2.37
|
| 7. | Dulhasti | - | - | - | - | - | - | 800 | 260 | 3.25
|
| C | NPC
|
| 1. | NAPP | 389 | 88.91 | 2.20 | 268 | 59 | 2.21 | 289 | 64 | 2.21
|
| 2. | RAPP | 187 | 52.17 | 2.79 | 472 | 125 | 2.65 | 701 | 186 | 2.65
|
| D | Other Sources
|
| 1. | Co-gen. | 152 | 53.05 | 3.49 | 103 | 37 | 3.63 | 137 | 50 | 3.63
|
| 2. | Banking
|
| i) | HPSEB | 192 | 43.97 | 2.29 | 159 | 37 | 2.34 | 150 | 35 | 2.33
|
| ii) | J&K | 129 | 29.41 | 2.28 | 117 | 28 | 2.37 | 126 | 30 | 2.37
|
| iii) | UPCL | 106 | 27.03 | 2.55 | 210 | 57 | 2.73 | 206 | 56 | 2.73
|
| 3. | NJPC | 683 | 160.51 | 2.35 | 616 | 141 | 2.29 | 701 | 160 | 2.28
|
| 4. | Tehri | 35 | 10.50 | 3.00 | - | - | - | 501 | 175 | 3.49
|
| 5. | PTC/others | 2679 | 543.84 | 2.03 | 4161 | 1189 | 2.86 | 4339 | 1275 | 2.94
|
| E | Other Charges
|
| 1. | PGCIL | - | 124.09 | - | - | 133 | - | - | 139 | -
|
| 2. | ULDC | - | 11.17 | - | - | 10 | - | - | 10 | -
|
| 3. | NRLDC | - | 0.92 | - | - | 1 | - | - | 1 | -
|
| | Total | 11746 | 2171.22 | 1.85 | 12984 | 2936 | 2.26 | 14849 | 3553 | 2.39
|
The Board in its ARR for the year 2005-06 has stated that its share in Dulhasti and Tehri will be available to the Board during 2005-06. Subsequently, vide letter No. 3762/66 dated April 4, 2005 in connection with Petition No. 5/2005 regarding authorizing the Board to impose power cuts for the year 2005-06, the Board has submitted that availability of power from Dulhasti and Tehri is still not confirmed and as such has not been included in the actual availability in Petition No. 5/2005.
Power purchase from NHPC stations in 2005-06 has been estimated by the Board on the basis of past 3 years average purchase from these stations.
Power purchase from NTPC and NPC stations during 2005-06 first half has been estimated by the Board by considering allocated and unallocated share earmarked to the Board during 2004-05 first half while during 2005-06 second half, energy available from only permanently allocated share of the Board from these stations has been considered. It has been submitted that the Board has little control on external transmission losses and that the Board has incurred external losses of about 6.7% on power procurement from PTC and about 8.59% on power procurement from NVVNL during the first six months of 2004-05.
Further, the Board has submitted that the Commission may issue appropriate Power Purchase Cost Adjustment formula to ensure regular recovery from the consumers, of any increase in average purchase price of individual stations as well as any change in procurement mix.
7.8.2 Requirement of Energy through Purchase
As discussed in para 7.5, the total energy requirement for the year 2005-06 has been arrived at 31440 MU which is to be met from own thermal and hydro generation
including BBMB to the extent of 20952 MU and the balance 10488 MU (net) through purchases from central generating stations and other sources. The transmission loss external to the PSEB system has to be added to arrive at the quantum of energy to be purchased from various sources.
7.8.3 Transmission Losses External to the PSEB System
For the year 2005-06, the Board has projected the gross power purchase at 14849 MU and losses external to the PSEB system at 4.00%.
The losses in the Northern region upto 12/04 of 2004-05 were checked and found to be 3.92%.
The Commission has considered the external losses at 3.92% as per actuals in the Northern region upto 12/2004 of 2004-05. The gross energy to be purchased from various sources, thus, works out to 10916 MU (10488 MU & external loss 428 MU).
7.8.4 Entitlement from Central Generating Stations
For estimation of total energy availability from different central generating stations (CGS), the Commission has considered the average energy sent out for three years (2001-02, 2002-03 and 2003-04).The recent three year average is considered as it gives more reliable estimation.
For Hydro (NHPC) stations the Commission has considered firm share allocation of the Board for determining energy entitlement from these stations. In case of NTPC and NPC stations, in addition to the firm share allocation, these stations have an unallocated share of 15%. In view of this, the Commission has considered average actual share allocation of the Board for three years (2001-02, 2002-03 and 2003-04) for determining total energy entitlement from NTPC and NPC stations. Based on above, the energy entitlement of the Board from NTPC , NHPC and NPC stations was worked out during the course of Tariff Order for the year 2004-05 as 4912 MU,1777 MU and 576 MU respectively. On the same basis the station-wise details of energy entitlement from NTPC, NHPC and NPC stations are given below in Table 7.21 to 7.23.
Table – 7.21
PSEB’s Entitlement from NTPC stations for 2005-06
| Sr.No | Station | Capacity (MW) | Firm Allocation | Total availability (Three year average ESO)(MU) | Three year average share allocation (%) | Energy entitlement based on average ESO and average allocation(MU)
|
|---|
| % | MW
|
|---|
| 1 | 2 | 3 | 4 | 5 | 6 | 7 | 8
|
| 1. | Anta | 419 | 11.69 | 49 | 2752 | 12.54 | 345
|
| 2. | Auraiya | 663 | 12.52 | 83 | 4299 | 13.22 | 568
|
| 3. | Dadri Gas | 830 | 15.90 | 132 | 5144 | 16.50 | 849
|
| 4. | Singrauli | 2000 | 10.00 | 200 | 14685 | 10.85 | 1593
|
| 5. | Rihand | 1000 | 11.00 | 110 | 7163 | 11.85 | 849
|
| 6. | Unchahar-I | 420 | 8.57 | 36 | 2878 | 9.09 | 262
|
| 7. | Unchahar-II | 420 | 14.29 | 60 | 2949 | 15.13 | 446
|
| | Total | | | | | | 4912
|
Table – 7.22
PSEB’s Entitlement from NHPC stations for 2005-06
| Sl.No. | Station | Capacity (MW) | Firm Allocation | Total availability (Three year average ESO) (MU) | Energy entitlement based on average ESO and firm share allocation (MU)
|
|---|
| % | MW
|
|---|
| 1 | 2 | 3 | 4 | 5 | 6 | 7
|
| 1. | Salal | 690 | 26.67 | 184 | 3150 | 840
|
| 2. | Bairasul | 180 | 46.67 | 84 | 634 | 296
|
| 3. | Tanakpura | 94 | 18.05 | 17 | 442 | 80
|
| 4. | Chamera | 540 | 10.18 | 55 | 2205 | 224
|
| 5. | Uri | 480 | 13.75 | 66 | 2453 | 337
|
| | Total | | | | | 1777
|
Table – 7.23
PSEB’s Entitlement from NPC stations for 2005-06
| Sl.No | Station | Capacity (MW) | Firm Allocation | Total availability (Three year average ESO)(MU) | Three year average share allocation (%) | Energy entitlement based on average ESO and average allocation(MU)
|
|---|
| % | MW
|
|---|
| 1 | 2 | 3 | 4 | 5 | 6 | 7 | 8
|
| 1. | NAPP | 40 | 11.59 | 51 | 2977 | 13.07 | 389
|
| 2. | RAPP | 440 | 6.36 | 28 | 2938* | 6.36* | 187
|
| | Total | | | | | | 576
|
* For RAPP, average of 2001-02 and 2002-03 has been taken because generation during 2003-04 has been intimated by PSEB as 1265 MU and % share for 2003-04 has not been indicated by PSEB.
In addition to the existing central generating stations, the Commission has considered purchase of energy from Chamera-II and Nathpa Jhakri as projected by the Board. In view of the submissions made by the Board regarding availability of power from Dulhasti and Tehri, the Commission has considered purchase of energy from these stations at 50% of the projections made by the Board. Thus, the Commission has considered purchase from new central stations as given below in Table 7.24.
Table - 7.24.
Purchase from new Central Generating Stations
| Sr.No | Station | Purchase
(MU)
|
|---|
| 1 | 2 | 3
|
| 1. | Chamera-II | 187
|
| 2. | Dulhasti | 400
|
| 3. | Nathpa Jhakri | 701
|
| 4. | Tehri | 250
|
| | Total | 1538
|
7.8.5 Least Cost Power Purchase-Merit Order Dispatch
The central generating stations in Northern region have come under availability based tariff (ABT) regime from Ist December 2002. Under ABT regime, the beneficiary has to pay the capacity (fixed) charges irrespective of energy drawn in which case it is desirable to purchase maximum energy from the stations with low variable cost (energy charges). Normally, nuclear stations are must run stations and merit order dispatch will not apply to these stations .Similarly merit order dispatch will not apply to co-generation and other non conventional energy power plants. The generation from each station is dispatched on hourly basis based on the system demand.
Under energy shortage conditions such an exercise may not be necessary, as the Board may have to draw its entitlement from each of the stations.
The own generating stations of the Board, nuclear stations, co-generating plants etc. are not considered in the merit order. The purchases from other sources through bilateral contract etc. will also not come under merit order.
7.8.6 Cost of Power Purchase
(a) Central Generating Stations (CGS)
CERC has issued regulations for terms & conditions for electricity tariff for the five year period beginning April 1, 2004. The Board has intimated that for individual CGSs, Tariff Orders for the year 2004-05 have not yet been finalised by CERC.
NTPC Stations
Fixed Cost
As per the prevalent mechanism the fixed cost is payable in proportion to the share allocation in respect of central generating stations and the Commission has accordingly arrived at the fixed charges.
Since Tariff Orders for individual central generating stations, have not been issued by CERC, the annual fixed charges in respect of NTPC stations have been considered as per NTPC bills for September, 2004. These are subject to revision based on the CERC orders as per CERC tariff regulations applicable from April 1, 2004.
Variable Cost
In the absence of CERC orders as per CERC tariff regulations applicable from
April 1, 2004, the Commission approves variable cost for 2005-06 as per NTPC bills for September, 2004 for different central generating stations. Change in the variable cost from these levels would be passed on to the consumers as FCA with prior approval of the Commission.
Incentive and Other Charges
The incentive and other charges are approved as projected by the Board in its ARR for the year 2005-06.
NHPC Stations
The actual rate for primary energy in respect of purchases from NHPC stations as per September, 2004 bills is 69.47 Ps/kwh. As per CERC regulations effective from April 1, 2004, recovery through primary energy charge shall not be more than annual capacity charge. Accordingly, the Commission approves the variable cost in respect of NHPC stations at 69 Ps/kwh but limited to annual capacity charge.
The incentive and other charges including income tax, foreign exchange rate variation etc. are considered as projected by the Board.
NPC Stations
The tariff for NAPP and RAPP stations has been considered by the Commission as per bills for September, 2004. The other charges are considered as projected by the Board.
(b) Power Purchase Tariff for New Stations
The following tariff rates including other charges have been assumed by the Board for power purchase from new stations for the year 2005-06.
| 1. | NJPC | Rs.2.28/kwh
|
| 2. | Chamera-II | Rs.2.27/kwh
|
| 3. | Tehri | Rs.3.49/kwh
|
| 4. | Dulhasti | Rs.3.25/kwh
|
The Commission notes that it would consider only the CERC order in this regard, with whom finalization of tariff is still pending though provisional rate of 235 paise per unit was agreed upon for NJPC plant and rate of 228 paise per unit was approved as cost of power from Chamera-II plant. The Commission approves these rates. The rates for Tehri and Dulhasti as projected by the Board are approved by the Commission subject to final rate to be approved by the CERC.
(c) Power Purchase Rates for Banking from Other States projected by the Board are:-
| HPSEB | Rs.2.33/kwh
|
| J & K | Rs.2.37/kwh
|
| UPCL | Rs.2.73/kwh
|
The above rates are applicable for the purchase of power during summer and sale of power during winter. The Commission provisionally accepts these rates for estimating the cost.
(d) Power Purchase from PTC
For estimating cost of additional power purchase from PTC, the Board has assumed that the cost of power purchase from these sources would be Rs.2.94/unit. Data regarding actual power purchases upto December,2004 was obtained from the Board. The total purchases from traders i.e PTC/NVVNL, upto December,2004 are 1349.89 MU at a cost Rs.327.74 crores thus giving an average rate of Rs.2.43/kwh. The Commission, thus, approves rate of Rs.2.43/kwh for power purchase from PTC.
(e) Transmission Charges
The Board has projected the transmission charges to PGCIL at Rs.139 crores for the year 2005-06. In addition ULDC charges have been projected at Rs.10 crores and NRLDC charges have been projected at Rs.1.00 crore. The Commission approves these charges as projected by the Board.
The power purchase requirement approved is 10916 MU against 14849 MU projected by the Board.
Based on the above, the cost of power purchase for the year 2005-06 works out to Rs.2259.66 crores as detailed below in Table 7.25.
Table - 7.25
Power Purchase Cost 2005-06
| Sr. No. | Source | Purchase (MU) | AFC (Rs. Crore) | PSEB share(%) | VC (Ps/ Unit) | FC (Rs. crores) | VC (Rs.crore) | Others (Rs.crore) | Total (Rs.crore)
|
|---|
| 1 | 2 | 3 | 4 | 5 | 6 | 7 | 8 | 9 | 10
|
| I | NTPC
|
| 1. | Anta | 345 | 79.49 | 12.54 | 144 | 9.97 | 49.68 | 1.00 | 60.65
|
| 2. | Auraiya | 568 | 144.44 | 13.22 | 174 | 19.09 | 98.83 | 1.00 | 118.92
|
| 3. | Dadri Gas | 849 | 210.96 | 16.50 | 162 | 34.81 | 137.54 | 10.00 | 182.35
|
| 4. | Singrauli | 1593 | 364.59 | 10.85 | 85 | 39.56 | 135.41 | 13.00 | 187.97
|
| 5. | Rihand | 849 | 499.25 | 11.85 | 70 | 59.16 | 59.43 | 8.00 | 126.59
|
| 6. | Unchahar-I | 262 | 195.94 | 9.09 | 112 | 17.81 | 29.34 | 2.00 | 49.15
|
| 7. | Unchahar-II | 446 | 221.21 | 15.13 | 111 | 33.47 | 49.51 | 1.00 | 83.98
|
| II | NHPC
|
| 8. | Salal | 840 | 173.25 | 26.67 | 55 | - | 46.21 | 15.00 | 61.21
|
| 9. | Bairasuil | 296 | 46.86 | 46.67 | 69 | 1.45 | 20.42 | 6.00 | 27.87
|
| 10. | Tanakpur | 80 | 44.67 | 18.05 | 69 | 2.54 | 5.52 | 1.00 | 9.06
|
| 11. | Chamera-I | 224 | 209.32 | 10.18 | 69 | 5.85 | 15.46 | 5.00 | 26.31
|
| 12. | Chamera-II | 187 | - | 13.20 | 228 | - | 42.64 | -- | 42.64
|
| 13. | Uri | 337 | 513.59 | 13.75 | 69 | 47.37 | 23.25 | 8.00 | 78.62
|
| 14. | Dulhasti | 400 | - | - | 325 | - | 130.00 | -- | 130.00
|
| III | NPC
|
| 15. | NAPP | 389 | - | 13.07 | 222 | - | 86.36 | -- | 86.36
|
| 16. | RAPP | 187 | - | 6.36 | 279 | - | 52.17 | -- | 52.17
|
| IV | Other Sources
|
| 17. | Co-gen. including Jalkheri | 137 | - | - | 363 | - | 49.73 | - | 49.73
|
| 18. | Banking | | - | - | | - | | - |
|
| a) | HPSEB | 150 | - | - | 233 | - | 34.95 | - | 34.95
|
| b) | J&K | 126 | - | - | 237 | - | 29.86 | - | 29.86
|
| c) | UPCL | 206 | - | - | 273 | - | 56.24 | - | 56.24
|
| 19. | NJPC | 701 | - | 11.92 | 235 | - | 164.74 | - | 164.74
|
| 20. | Tehri | 250 | - | 17.90 | 349 | - | 87.25 | - | 87.25
|
| 21. | PTC/Others | 1494 | - | - | 243 | - | 363.04 | - | 363.04
|
| V | Other Charges | | - | | | - | | - |
|
| 22. | PGCIL | | - | | | - | | 139.00 | 139.00
|
| 23. | ULDC | | - | | | - | | 10.00 | 10.00
|
| 24. | NRLDC | | - | | | - | | 1.00 | 1.00
|
| | Total | 10916 | - | | | 271.08 | 1767.58 | 221.00 | 2259.66
|
The Commission approves power purchase cost at Rs. 2259.66 crores for power purchase of 10916 MU against Rs.3553 crores projected by the Board for power purchase of 14849 MU.
However, the Commission is of the opinion that the cost of power purchase including purchase under UI is not entirely within the control of the Board in shortage scenario. In view of this, if at the end of year, there is any increase in the quantum of power purchase, cost of the same will be allowed by the Commission subject to (a) intimation to the Commission ; (b) the power is purchased by the Board on merit order basis and (c) full recovery of cost of additional power purchase is ensured.
7.9 EMPLOYEES COST
In the ARR for the year 2005-06, the Board has projected the employees cost at Rs.1700 crores net of capitalization of Rs.80 crores for the year 2005-06. The employees cost as per actuals for the years 2002-03 and 2003-04, revised estimates for the year 2004-05 along with the projections by the Board for the year 2005-06 are given in Table 7.26 below:
Table-7.26
(Rs. in crores)
| Year | Net employees cost as per the Board
|
|---|
| 1 | 2
|
| 2002-03 | 1274.66
(Actual)
|
| 2003-04 | 1378.83
(Actual)
|
| 2004-05 | *1605.40
(RE)
|
| 2005-06 | 1700.00
(Projections)
|
*Re-revised to Rs.1560 crores as per presentation dated April 11, 2005
The above table shows that the employees cost has been increasing year after year despite Commission’s clear directions to contain the employees cost. The actual employees cost for the last three years has been increasing and is much higher than approved by the Commission. During processing of the ARR for the year 2002-03, the Commission had noted that the employees cost constitutes 65 paise per unit cost of energy supplied by the Board. It is worth while to mention here that even the Government of Punjab had commented adversely on the high employees cost during the year 2002-03. It had suggested to approve employees cost at Rs.1123.83 crores based on norm of 3.5 employees per MU of energy sold against the then projections of Rs.1316.50 crores by the Board for the year 2002-03. Applying the same norm, the employees cost for the year 2005-06 will work out to Rs.1490.33 crores against Rs.1700.00 crores projected by the Board. It shows that the employees cost as projected by the Board is much higher than the cost which could be approved on the basis of the norm suggested by the Government. This indicates that the Board has neither been able to contain the employees cost as directed by the Commission nor achieved the norm of 3.5 employees per MU as suggested by the Government of Punjab. The employees cost is one of the highest in the country. Of late, the Board in its ARR for the year 2005-06 has taken a stand that it can not reduce the employees cost beyond cost cuttings on account of retirement due to the permanent status of existing employees and historical reasons. The Commission views the reduction in number of employees due to retirements more as a matter of natural attrition in which the Board does not have substantial role to play.
The Board has also stated that its employees had to be sanctioned the revised scales of pay on the recommendations of the Pay Commission as accepted by the State Government for its employees. Further, it has stated that introduction of VRS would be a costlier proposition and it does not have resources to fund a VRS at present. The Commission notes that the Board has never floated the proposed VRS even to assess its acceptability amongst its employees knowing fully well that it has surplus manpower.
In reply to the deficiency letter, the Board has stated that the Board had conducted a staffing norm study in the distribution sector during the year 2001. As per the study, there were about nine thousand surplus posts in the distribution organization. This report has been updated as per the current business of the Board and it has been found that there is surplus of only about 1500 posts in the cadre of Lineman and Assistant Lineman. However, there is large shortage in other categories like, JEs, Foreman, UDCs, LDCs, Cashiers and Bill Distributors etc. The Board has, therefore, requested the Commission to appreciate that the Board has practically implemented new staffing norms and the remaining surplus staff has been appropriately redeployed against the existing vacancies in other cadres. The Commission is of the view that rationalization of the present staff strength of the Board is the need of the hour for which it needs to take further steps to relocate the available staff as per genuine requirements of each operation sector after imparting training, if necessary.
The Board has also cited Supreme Court verdict in the case of WBSERC v/s CESC Limited of 2002 to justify its stand that the amount spent towards employees cost should not be treated as amount not properly incurred by the utility. As such, it has pleaded that the actual amount spent by the Board as employees cost should be allowed for the purpose of Tariff determination. In this context, the Commission has already made it clear in para 7.11 of the Tariff Order for the year 2004-05 that in its humble opinion, the order of the Apex Court does not legalize unrestrained, unjustifiable and continuing escalation in the employees cost of the Board especially when such increase is not tied to corresponding improvements in productivity of the highly paid employees. The Hon’ble Court has not ruled that every rupee of the cost incurred by the Board on the employees has to be reimbursed at the cost of the consumers. The order allows as pass through only such costs which are incurred prudently and are the minimum payable in terms of the clear provisions of binding and legally enforceable agreements.
The Board has further asserted that the maximum that it could do in this direction was to impose a ban on new recruitment. The Board, as such, had made no fresh recruitments against the posts fallen vacant as a result of retirements for the last many years. The Board has also stated that the disallowance of employees cost by the Commission is the highest as compared to certain other SERCs. In this regard, the Commission wishes to make clear that as laid down in the Electricity Act, 2003, the Commission is bound to allow only the reasonable costs based on commercial principles safeguarding consumers’ interest as well. As such, the percentage of unjustified costs disallowed by any Commission in the matter is not relevant. In fact, viewed from another angle, it can also be taken to mean that the efforts of the Board to curtail expenditure under this head are not adequate.
As regards the exorbitant cost increase of 33.37% projected for the year 2005-06 over the approved employees cost for the year 2004-05, the Board has stated that this was due to the merger of dearness allowance with the basic pay on the recommendations of Fifth Pay Commission as accepted by the State Government on which the Board has little control. Increase in Basic Pay, House Rent Allowance and Dearness Allowance of the Board employees are also cited as other reasons for increased projections for the year 2005-06. In this regard the Commission feels that the increase in different components of salary can not justify the high employees cost in any way. As such, the Commission is not much concerned about the split up of salary in different components instead it is the overall cost in totality which matters. The Commission notes that the Board has not elucidated as to why higher targets of productivity and better quality services to the consumers could not be fixed while granting the additional emoluments to its employees.
Further, the plea of the Board that the employees cost for its thermal and hydro electricity generating stations is well below the norms laid down by the CERC is not tenable as the norms of the CERC referred to by the Board do not cover all the components of employees cost of the Board. The Commission wants to make it clear that generating station-wise employees cost becomes meaningless when the same is to be determined for the Board as a whole covering all its activities.
An analysis of the employees cost of the Board in comparison to that of the other Electricity Boards in the country for the year 2001-02 is given in Table 7.27 below.
Table -7.27
Employees Cost of the Board compared to other State Electricity Boards
for the year 2001-02
| Sr. No | State Electricity Boards | No. of consumers in million | No. of employees | Employee per MU of electricity sold | Employee per 1000 consumers | Share of Estt./Admn in total cost % | Estt.expensesin paise/ kwh of sale
|
|---|
| 1 | 2 | 3 | 4 | 5 | 6 | 7 | 8
|
| 1. | Andhra Pradesh | 13.55 | 61671 | 2.07 | 4.55 | 7.07 | 25.51
|
| 2. | Gujarat | 7.10 | 47782 | 1.46 | 6.73 | 9.79 | 35.76
|
| 3. | Karnataka | 10.82 | 38106 | 1.95 | 3.52 | 12.58 | 47.14
|
| 4. | M.P. | 8.14 | 88572 | 3.34 | 10.88 | 14.00 | 45.49
|
| 5. | Maharashtra | 12.98 | 111724 | 2.37 | 8.61 | 12.03 | 43.00
|
| 6. | Punjab | 5.37 | 84171 | 3.65 | 15.67 | 19.26 | 54.94
|
| 7. | Tamil Nadu | 14.42 | 93504 | 2.57 | 6.49 | 15.59 | 48.29
|
| 8. | U.P. | 9.38 | 62740 | 2.24 | 6.69 | 13.11 | 50.30
|
| 9. | Average of all SEBs in India | | | 2.53 | 7.59 | 12.70 | 44.50
|
| 10. | All India Average (SEBs/ Deptt.) | | | 2.60 | 7.78 | 12.69 | 44.40
|
Source: Latest annual report for 2001-02 on the working of State Electricity Board’s and Electricity
Departments - Planning Commission, May, 2002.
It is evident from above that though the number of consumers of electricity is the least in case of Punjab compared to seven other states given in the table, it has the highest number of employees per MU sold or per thousand consumers. It also has the highest share of establishment expenses both in absolute terms as well as with reference to the cost per unit of electricity sold. This shows that the performance of the Board is far below the national average.
A latest comparative analysis of various productivity parameters of the employees of seven states for the year 2003-04 is given in Table 7.28 below:
Table -7.28
Comparative analysis for the year 2003-04
| Sr. No. | Name of SEB | No. of consumers | No. of emplo-yees | Energy sold in MU per employee | No. of consumers per employee | % of estt. exp. to total cost | Estt. exp. in paise/kwh of sale | Circuit in KM per emplo-yee
|
|---|
| 1 | 2 | 3 | 4 | 5 | 6 | 7 | 8 | 9
|
| 1. | Andhra Pradesh | 15870287 | 76679 | 0.45 | 207 | 3.91 | - | -
|
| 2. | Gujarat | 9958056 | 51537 | 0.74 | 193 | 6.92 | 24 | 7.84
|
| 3. | Madhya Pradesh | 6597849 | 74648 | 0.21 | 88 | 12.82 | 52 | 7.24
|
| 4. | Maharashtra | 16927863 | 103038 | 0.50 | 164 | 13.59 | 42 | 6.67
|
| 5. | Punjab | 5705751 | 96295 | 0.24 | 59 | 20.48 | 56 | 2.95
|
| 6. | Rajasthan | 5747725 | 11687 | 1.31 | 492 | 5.91 | 26 | -
|
| 7. | Tamil Nadu | 17025652 | 83949 | 0.47 | 203 | 13.13 | 40 | 7.33
|
Source: Central Electricity Authority, General Review for the year 2004-05
The comparative analysis of various parameters given in the above table shows no better position of the Board than that for the year 2001-02. It is evident from the above that the number of consumers of electricity is the least in case of Punjab compared to six other states given in the table. It is selling 0.24 MU per employee which is the second lowest and its each employee caters to 59 consumers ranking lowest amongst seven Electricity Boards compared. It has the highest percentage of establishment cost to total cost as it constitutes 56 paise per kwh cost of energy sold which is also the highest compared to other six states. The Board’s per employee cable line circuit is lowest being 2.95 KM against 7.84 KM circuit in respect of Gujarat state.
The Board in its subsequent submissions dated September 15, 2004 during the tariff proceedings for the year 2004-05 had pleaded before the Commission that the employees cost should not be kept capped at an absolute amount on a long term basis and it needs to be linked to performance parameters of productivity. The Commission felt convinced that there is some weight in this argument of the Board and therefore, the employees cost need not be kept capped at an absolute amount for a long period. It also felt that the employees cost should be allowed on pre determined norms of some parameters of productivity while fixing targets for improvements therein. The Commission made it clear in the Tariff Order for the year 2004-05 that some percentage of the savings over and above the fixed norms of productivity parameters could be considered for being allowed as an incentive to the Board. Therefore, the Commission had directed the Board to come up with a specific proposal in this connection failing which the Commission would be constrained to take decision on its own. The Board has not submitted any specific proposal in this regard so far. However, the Board in the ARR for the year 2005-06 has given a chart depicting six parameters of increase in employee productivity from 2003-04 to
2005-06 showing an increase of 6% in consumers, 10% in sanctioned load and 11% in energy sales besides increase in energy handled, revenue from tariff and reduction in number of employees.
These parameters and the improvements as projected by the Board do not fully serve the purpose of evolving principles for fixing employees cost linked to productivity since the increase / decrease in these cannot invariably be directly attributable to the efforts of the Board. In many cases these parameters may show improvement without any special efforts on the part of the Board as, for instance, in the case of increase in the revenue from sale of power resulting from enhanced tariff rates. Furthermore, judged on the basis of these very parameters, the present performance of the Board is well below the efficiency levels achieved by almost all the well performing utilities and even the national averages of all Boards / utilities. Thus, much of the improvements in these parameters which the Board may indicate will have to be first set off against the need to catch up with others. Furthermore, since these parameters may show diverse and differing trends for the same period, an index that reasonably consolidates all the trends will have to be evolved.
Further, the Board in its subsequent submissions dated April 22, 2005 has reiterated that besides steps of ban on new recruitments, creation of new charges, need based re-deployment of available manpower, the Board has ensured optimal use of existing manpower. Resultantly, the productivity in terms of number of consumers handled, connected load, energy handled and sold improved from 12 to 19% during 2001-02 to 2003-04. The improvement in productivity is comparable with other well performing states like Gujarat, Madhya Pradesh and Maharashtra etc. As such, the employees cost being bonafide expenditure should be allowed on actual basis as the Commission in Tariff Order 2004-05 had indicated its willingness to review its decision of capping the employees cost.
The Board vide its submissions dated May 12, 2005 justified employees cost by giving historical background since early sixties. It has also supplied various notifications of the Government of India vide which the Dearness Allowance of the employees was increased from time to time. It has alleged that while capping the employees cost at Rs. 1274.66 crore, the Commission has neither considered nor assessed nor examined factors / grounds / reasons which could impact the employees cost in subsequent years. The Commission had also not examined the issue whether the Board was in a position to control such increase in future years. Keeping in view these aspects, the Board has pleaded for allowing actual employees cost incurred during the year 2004-05 as a pass through while determining tariff for the year 2005-06.
The Government of Punjab vide letter dated May 3, 2005 has made a shift in its earlier stand and has opined that though it is concerned about the high employees cost, capping the cost does not seem possible as is evident in the Government itself. Total number of employees can and has been capped. It further supported the Board by stating that the Board has been making efforts to reduce its excessive manpower as there has been complete ban on recruitments since 1996 though the Board has been facing shortages of personnel in some technical categories and has made no further recruitment except some SDOs and Revenue Accountants. The Board has tried to make up shortfall through redeployment of existing manpower. The actual number of employees has gone down from 88994 in the year 2001-02 to 80091 in the year 2004-05 but the employees cost has gone up due to increments, hike in DA and terminal benefits. The Board’s performance on several parameters such as employees per MU of energy sold and employees per thousand consumers, has improved in last few years.
Furthermore, the Government considered it appropriate to allow terminal liabilities in full as the Commission had separately agreed on ‘pay as you go’ principle. The State Government have also suggested factoring in tariff the financial package of the Board in replacement of compassionate appointments. It has further stated that the employees cost is a legitimate historical component of cost of supply and should be allowed as pass through especially when the Board has not increased its employee strength in the past several years.
The Commission notes that there is vast difference between the actual expenditure on employees cost being incurred by the Board and the amount approved by the Commission. This difference will ultimately result in eroding the viability of the Board.
The Commission had earlier approved the employees cost at Rs.1274.66 crores on the basis of actual expenditure on this account for the year 2002-03. The Commission notes that no increase in employees cost was allowed by the Commission in the years 2003-04 and 2004-05. Thus, the year 2005-06 is the third year where increase in employees cost over the level of base year 2002-03 is to be considered. It is an accepted fact that each year there is increase in employees cost due to grant of DA installments, annual increments, promotions, re-fixation of pay etc. In the absence of any better indicators, such increases can best be based on growth in Wholesale Price Index - All Commodities starting from the year 2001-02 to
2004-05 every year. The Wholesale Price Index- All Commodities for March 2002, March 2003, March 2004 and March 2005 was at 161.9, 171.6, 179.8 and 188.5 respectively. It is clear that there was cumulative growth of 15.61 % from March 2002 to March 2005.
Keeping the above in view, the Commission considers it appropriate to allow cumulative increase of 15.61% for the year 2005-06 in the approved level of employees cost of Rs.1274.66 crores. Thus, the employees cost for the year 2005-06 works out to Rs.1473.63 crores. In case the Board desires higher increase, it may come up with detailed justification there for.
The Commission, therefore, approves an amount of Rs.1473.63 crores as employees cost for the year 2005-06.
7.10 OPERATION AND MAINTENANCE EXPENSES
In the ARR for the year 2005-06, the Board has submitted the actual operation and maintenance expenses for the year 2003-04, revised estimates for the year 2004-05 and the projections for the year 2005-06. The sub head-wise details of these expenses are given in Table 7.29 below:
Table -7.29
Operation and Maintenance Expenses
(Rs. in crores)
| Sr. No. | Particulars | 2003-04 (Actuals) | 2004-05(R.E.) | 2005-06(Proj.)
|
|---|
| 1 | 2 | 3 | 4 | 5
|
|---|
| 1. | Plant & machinery | 83.19 | 113.43 | 123.64
|
| 2. | Building | 7.74 | 9.95 | 10.85
|
| 3. | Hydraulic works & civil works | 3.62 | 6.51 | 7.10
|
| 4. | Line cable & network | 17.26 | 24.28 | 26.50
|
| 5. | Vehicles | 3.19 | 3.50 | 3.80
|
| 6. | Furniture & fixtures | 0.03 | 0.03 | 0.03
|
| 7. | Office equipments | 0.12 | 0.10 | 0.11
|
| 8. | Operating expenses | 15.52 | 17.90 | 19.50
|
| 9. | Total expenses | 130.67 | 175.70 | 191.53
|
| 10. | Add BBMB share | 66.58 | 69.00 | 75.20
|
| 11. | Less Capitalized | 1.71 | 2.00 | 1.73
|
| 12. | Net expenditure | 195.54 | 242.70 | 265.00
|
| 13. | Add Prior period items | 3.72 | - | -
|
| 14. | Net charged to Revenue | 199.26 | *242.70 | 265.00
|
* Re-revised to Rs. 224 crores as per presentation dated April 11, 2005
As is evident from above, the revised estimates of the Board for the year 2004-05 and the projections for the year 2005-06 are higher than the actuals for the year 2003-04. The Board has justified these higher projections stating that it has vintage thermal power stations and T&D network which needs to be maintained properly to ensure reasonable availability, reliability and quality of supply to the consumers. It has also stated that the Board has to reduce T&D losses which require significant maintenance efforts and costs. Besides, it has to maintain the system well to meet the demand growth. The Board has also stated that O&M cost as percentage of Gross Fixed Assets for the year 2004-05 is quite low at 1.8% which is far below the norm of 2.5% of fixed assets being adopted in the industry.
The Commission notes that no uniform policy is being followed by other Electricity Regulatory Commissions in determining O&M expenses. The Commission takes cognizance of the huge efforts required of the Board in up gradation of the system to ensure reliability of energy supply to the consumers. In view of this, the Commission considers it appropriate to allow operation and maintenance expenses of Rs.265 crores as projected in the ARR by the Board.
The Commission, therefore, approves Rs.265 crores as operation and maintenance expenses for the year 2005-06.
7.11 ADMINISTRATION AND GENERAL EXPENSES
Administration and General expenses account for expenditure on a number of items of miscellaneous nature; such as, rents, taxes, insurance, conveyance, travel, telephones, consultancy fee, water and electricity charges etc. In the ARR for the year 2005-06, the Board has projected administration and general expenses at Rs.55 crores net of capitalization of Rs.16.62 crores for the year 2005-06. The Board has estimated this level of expenditure by taking into account the inflation rate of 7-8% per annum over the actuals of 2003-04 and estimated increase in system growth @5% per annum.
The administration and general expenses as approved by the Commission in truing up exercise for the year 2003-04, revised estimates for the year 2004-05 and projections for the year 2005-06 by the Board are given in Table 7.30 below:
Table –7.30
Administration and General Expenses
(Rs. in crores)
| Sr. No. | Sub-head | 03-04(Appd.) | 04-05(R.E.) | 05-06(Proj.)
|
|---|
| 1 | 2 | 3 | 4 | 5
|
| 1. | Rent, rates & taxes | 2.34 | 2.90 | 3.10
|
| 2. | Insurance | 1.15 | 3.00 | 3.30
|
| 3. | Telephone, postage & telegrams | 5.93 | 7.00 | 7.70
|
| 4. | Consultancy fees | 0.20 | 0.30 | 0.35
|
| 5. | Technical fees | 0.01 | 0.01 | 0.02
|
| 6. | Other professional charges | 0.03 | 0.03 | 0.05
|
| 7. | Conveyance & travel expenses | 12.11 | 13.00 | 14.30
|
| 8. | Electricity & water charges | 10.39 | 11.00 | 12.00
|
| 9. | Others | 14.74 | 15.50 | 17.00
|
| 10. | Freight | 0.76 | 0.80 | 0.90
|
| 11. | Other material related expenses | 8.15 | 9.00 | 9.90
|
| 12. | Total expenses | 55.81 | 62.54 | 68.62
|
| 13. | Add BBMB share | 2.00 | 2.70 | 3.00
|
| 14. | Less capitalized | 12.18 | 15.24 | 16.62
|
| 15. | Net expenditure | 45.63 | 50.00 | 55.00
|
As per accounts of the Board, the actual expenditure under this head was Rs.45.63 crores for the year 2003-04 which has been approved now by the Commission. The Board has stated in the ARR that there is inflation of 7-8% per annum and its business expansion is 5% per annum. In view of this justification of the Board, the Commission approves administration and general expenses of Rs.50.31 crores for the year 2005-06 by allowing increase of 5% over the approved expenditure of Rs.47.91 crores for the year 2004-05.
The Commission, as such, approves Rs.50.31 crores as administration and general expenses for the year 2005-06.
7.12 DEPRECIATION
In the ARR for the year 2005-06, the Board has indicated depreciation charges for the years 2003-04(actuals), 2004-05(revised) and 2005-06(projections) as per details given in Table 7.31 below:
Table –7.31
Depreciation Charges as per ARR for the year 2005-06
(Rs. in crores)
| Item | Assets on 1.4.03 | 03-04Depreciation(Actuals) | Assets on 1.4.04 | 04-05 Depreciation(R.E.) | Assets on 1.4.05 | 05-06 Depreciation(Proj.)
|
|---|
| 1 | 2 | 3 | 4 | 5 | 6 | 7
|
| Thermal | 2800.33 | 146.15 | 2868.24 | 149.69 | 2868.24 | 149.69
|
| Hydro | 5583.21 | 143.06 | 5633.20 | 144.34 | 5633.20 | 144.34
|
| Internalcombustion | 2.68 | 0.02 | 2.68 | 0.02 | 2.68 | 0.02
|
| Transmission | 1398.76 | 81.05 | 1485.75 | 86.09 | 1685.75 | 97.68
|
| Distribution | 2998.90 | 190.33 | 3280.74 | 208.21 | 3614.74 | 229.41
|
| Others | 136.74 | 2.89 | 136.74 | 2.89 | 136.74 | 2.89
|
| Total | 12920.62 | 563.50 | 13407.35 | 591.25 | 13941.35 | 624.04
|
In para 3.13 of the Tariff Order for the year 2004-05, the Commission had approved depreciation charges of Rs.549.06 crores for the year 2003-04 as claimed by the Board. Similarly, the depreciation charges for the year 2004-05 were approved at Rs.576.12 crores in para 7.14 of the Tariff Order for the year 2004-05 as projected by the Board based on function-wise value of assets at the beginning of the year. The function-wise percentage rates of depreciation have changed due to change in the amount of depreciation on actual basis for the year 2003-04. Now, due to this change in function-wise percentage rate of depreciation, the Board has revised the amount of depreciation charges for the year 2004-05 also.
From the perusal of the two ARRs for the years 2004-05 and 2005-06, it is noted that the Board has depicted the same value of the gross fixed assets as on April 1, 2003. But there is slight difference in the value of assets as on April 1, 2004 which has been increased to Rs.13407.35 crores in place of Rs.13401.46 crores disclosed earlier. It is also noted that the value of transmission assets has been decreased by corresponding increase in the value of distribution assets which has higher rate of depreciation. Because of this inter-change in value of assets, the depreciation charges for the year 2004-05 have also increased. The amount of depreciation charges for the year 2005-06 has also been worked out on the basis of function wise depreciation rates arrived at for the year 2004-05 as given in Table 7.32 below:
Table-7.32
Depreciation Charges approved for the year 2005-06
(Rs. in crores)
| Item | 2004-05 | 2005-06
|
|---|
| Assets as on 1.4.04 as per balance sheet | Rate % | Depreciation For 04-05 | Assets as on 1.4.05 | Rate % | Depreciationfor 05-06
|
|---|
| 1 | 2 | 3 | 4 | 5 | 6 | 7
|
| Thermal | 2868.24 | 5.22 | 149.69 | 2868.24 | 5.22 | 149.69
|
| Hydro | 5633.20 | 2.56 | 144.34 | 5633.20 | 2.56 | 144.34
|
| Internal Combustion | 2.68 | - | 0.02 | 2.68 | - | 0.02
|
| Transmission | 1485.75 | 5.79 | 86.09 | 1645.75 | 5.79 | 95.29
|
| Distribution | 3280.74 | 6.35 | 208.22 | 3614.74 | 6.35 | 229.54
|
| Others | 136.74 | 2.11 | 2.89 | 136.74 | 2.11 | 2.89
|
| Total | 13407.35 | 4.48 | 591.25 | 13901.35 | 4.48 | 621.77
|
In view of above, the Commission approves Rs.621.77 crores as depreciation charges for the year 2005-06.
7.13 INTEREST AND FINANCE CHARGES
In the ARR for the year 2005-06, the Board has depicted actuals of interest and finance charges for the year 2003-04, revised estimates for the year 2004-05 and projections for the year 2005-06 as per Table 7.33 below:
Table -7.33
Interest and Finance Charges as per ARR
(Rs. in crores)
| Sr. No. | Item | 03-04(Actuals) | 04-05(R.E.) | 05-06(Proj.)
|
|---|
| 1 | 2 | 3 | 4 | 5
|
|---|
| 1. | SLR Bonds | 21.19 | 18.84 | 18.84
|
| 2. | Non SLR Bonds | 220.47 | 165.41 | 132.39
|
| 3. | LIC | 118.59 | 72.44 | 65.95
|
| 4. | REC | 75.97 | 86.60 | 145.94
|
| 5. | Commercial Banks | 34.02 | 26.67 | 19.93
|
| 6. | Bills discounting | 1.61 | 0.42 | -
|
| 7. | Lease rental | 36.58 | 15.13 | 8.70
|
| 8. | PFC | 59.81 | 55.00 | 48.48
|
| 9. | GPF | 86.75 | 100.00 | 100.00
|
| 10. | CSS | 7.72 | 13.40 | 20.14
|
| 11. | Working capital loan | 37.54 | 33.57 | 48.88
|
| 12. | Others | 3.31 | 3.71 | 5.00
|
| 13. | Prior period interest | (28.14) | - | -
|
| 14. | Total | 675.42 | 591.19 | 614.25
|
| 15. | State Govt. loan | 483.09 | 483.09 | 483.09
|
| 16. | Grand total | 1158.51 | 1074.28 | 1097.34
|
| 17. | Less capitalization | 56.29 | 93.62 | 160.64
|
| 18. | Net interest charges | 1102.22 | 980.66 | 936.70
|
| 19. | Finance charges | 12.81 | 20.00 | 30.00
|
| 20. | Net interest and finance charges | 1115.03 | *1000.66 | 966.70
|
* Re-revised to Rs. 1011 crores as per presentation dated April 11, 2005
7.13.1 Loans Outstanding
The Board has submitted a statement of loans showing opening balance, receipt, payment and closing balance as on March 31, 2005 and March 31, 2006 as per Table 7.34 given below:
Table -7.34
Receipt and Payment of loans as per ARR
(Rs. in crores)
| Sr. No | Particulars | Balanceas on 31.3.04 | 04-05(R.E.) | Balance as on 31.3.05 | 05-06 (Proj.) | Balanceas on31.3.06
|
|---|
| Receipt | Payment | Receipt | Payment
|
|---|
| 1 | 2 | 3 | 4 | 5 | 6 | 7 | 8 | 9
|
| 1. | SLR bonds | 158.00 | 00.00 | 00.00 | 158.00 | 00.00 | 00.00 | 158.00
|
| 2. | LIC | 696.04 | 00.00 | 59.44 | 636.60 | 00.00 | 58.65 | 577.95
|
| 3. | PFC | 408.27 | 150.00 | 79.08 | 479.19 | 80.00 | 88.21 | 470.98
|
| 4. | Commercial Banks | 307.37 | 175.00 | 105.70 | 376.67 | 00.00 | 267.95 | 108.72
|
| 5. | C.S.S.
|
| | (i)APDRP | 43.75 | 54.00 | 3.02 | 94.73 | 75.00 | 4.38 | 165.35
|
| | (ii)Others | 2.39 | 00.00 | 1.44 | 0.95 | 00.00 | 0.75 | 0.20
|
| 6. | REC
|
| | (i) schemes | 672.08 | 220.00 | 82.93 | 809.15 | 360.00 | 144.57 | 1024.58
|
| | (ii) MHP-II | 32.66 | 33.00 | 00.00 | 65.66 | 52.00 | 00.00 | 117.66
|
| | (iii)GHTP-II | 00.00 | 100.00 | 00.00 | 100.00 | 00.00 | 00.00 | 100.00
|
| | | 00.00 | 190.00 | 00.00 | 190.00 | 648.00 | 00.00 | 838.00
|
| | (iv)R&M/ BBMB | 00.00 | 10.00 | 00.00 | 10.00 | 24.00 | 00.00 | 34.00
|
| | (v) Shahpur kandi | 00.00 | 00.00 | 00.00 | 00.00 | 90.00 | 00.00 | 90.00
|
| | (vi)Doraha Gas | 00.00 | 00.00 | 00.00 | 00.00 | 90.00 | 00.00 | 90.00
|
| | (vii) R&M GNDTP 3&4 | 00.00 | 00.00 | 00.00 | 00.00 | 80.00 | 00.00 | 80.00
|
| | (viii )R&M GGSTP | 00.00 | 19.00 | 00.00 | 19.00 | 21.00 | 00.00 | 40.00
|
| 7. | Bill discounting | 9.75 | 00.00 | 9.75 | 00.00 | 00.00 | 00.00 | 00.00
|
| 8. | Non SRL bonds | 1501.45 | 217.00 | 533.74 | 1184.71 | 356.00 | 275.68 | 1265.03
|
| 9. | G.A.C.L. | 7.88 | 00.00 | 7.88 | 00.00 | 00.00 | 00.00 | 00.00
|
| 10. | Sub total | 3839.64 | 1168.00 | 882.98 | 4124.66 | 1876.00 | 840.19 | 5160.47
|
| 11. | W.C.L. | 260.00 | 600.00 | 260.00 | 600.00 | 850.00 | 600.00 | 850.00
|
| 12. | Total | 4099.64 | 1768.00 | 1142.98 | 4724.66 | 2726.00 | 1440.19 | 6010.47
|
| 13. | G.o.P Loans | 4537.53 | 00.00 | 00.00 | 4537.53 | 00.00 | 00.00 | 4537.53
|
| 14. | G .Total | 8637.17 | 1768.00 | 1142.98 | 9262.19 | 2726.00 | 1440.19 | 10548.00
|
7.13.2 Investment Plan
The investment plan as submitted by the Board for the years 2004-05 (R.E.) and 2005-06 (Proj.) is as per Table 7.35 given below:
Table-7.35
Investment Plan as per ARR
(Rs. in cores)
| Name of Scheme /Project | 04-05(R.E.) | 05-06(Proj.)
|
|---|
| 1 | 2 | 3
|
| Ranjit Sagar Dam Project | 00.94 | 00.00
|
| Shahpur kandi HEP | 00.00 | 100.00
|
| Mukerian Hydro Electric Project Stage-II | 26.50 | 60.00
|
| Micro Hydel Power Houses at Ropar | 12.00 | 6.50
|
| R&M of Bhakra Power Houses | 5.50 | 30.00
|
| Shanan & Other Board Projects | 25.00 | 20.00
|
| GHTP Stage-I | 11.00 | 2.00
|
| GHTP Stage-II Lehra Mohabbat | 225.00 | 810.00
|
| Doraha gas Based Thermal Plant | 00.00 | 100.00
|
| R&M works at Thermal Plants as per RLA study (unit-I & II) | 134.00 | 81.00
|
| R&M of GNDTP Bhatinda Phase-II | 3.00 | 1.00
|
| R&M GNDTP Bhatinda Unit-III&IV based on RLA study | 0.10 | 100.00
|
| R&M of GGSSTP Ropar under APDRP scheme | 37.00 | 27.00
|
| Transmission & Distribution including APDRP | 400.00 | 500.00
|
| Revamping of ME Labs. and workshops | 2.00 | 2.00
|
| Release of tube-well connections | 100.00 | 100.00
|
| Rural Electrification (PMGY) | 5.00 | 5.00
|
| Urban Pattern supply (24 hours) to villages | 250.00 | 00.00
|
| Survey & Investigation | 0.50 | 0.50
|
| Implementation of Plans for the Board | 1.40 | 5.00
|
| HRD Programmes (setting of staff college) | 0.06 | 6.00
|
| Total | 1239.00 | 1956.00
|
The Board has proposed an ambitious investment plan of Rs.1956 crores for the year 2005-06. The actual capital expenditure during the years 2001-02, 2002-03 and 2003-04 as per accounts is Rs.462.06 crores, Rs.336.20 crores and Rs.562.49 crores respectively against the approved amount of Rs.783 crores and Rs.800 crores for the years 2002-03 and 2003-04 respectively. The actual capital expenditure is quite on lower side as compared to the approved amount of investment for previous years as also to the level of projections for the year 2005-06. The Board has not intimated the actual expenditure for the year 2004-05. Therefore, placing reliance on the actual expenditure incurred during the years prior to 2004-05, it can be concluded that the capital expenditure during the year 2005-06 can hardly be expected to come up to the level of Rs.1956 crores as estimated by the Board in the investment plan. The Commission, therefore, expects that the capital expenditure of the Board during the year 2005-06 can hardly exceed Rs.1200 crores at the most. The Commission, therefore, approves investment plan of Rs.1200 crores only.
7.13.3 Working Capital
The Board had proposed working capital requirement at Rs.250 crores for the year 2004-05 in the ARR for the year 2004-05. The Commission had accordingly approved in para 7.15.3 of the Tariff Order for the year 2004-05 the proposed working capital requirement and had allowed interest of Rs.18.50 crores thereon as claimed by the Board. Now, in the ARR for the year 2005-06, the Board has revised this requirement to Rs.600 crores for the year 2004-05 against which the Commission has now re-determined the working capital requirement of Rs.495.95 crores in para 3.14.2 of the Tariff Order for the year 2005-06. The Board has proposed working capital requirement of Rs.850 crores for the year 2005-06. It is worth while to mention here that the actual working capital loans for 2003-04 were Rs.460 crores only as per ARR for the year 2003-04. Thus, the steep increase in the requirement of working capital for the year 2005-06 is not justified. Since the proposals for the year 2005-06 are mere estimates, the Commission considers it appropriate to place reliance on the levels of expenditure approved by it under different heads for the current year. The requirement of working capital for one month based on approvals under each head works out as given in Table 7.36 below:
Table -7.36
Working Capital Requirement
(Rs. in crores)
| One month fuel cost | 181.35
|
| One month power purchase cost | 188.31
|
| One month cash requirement (1/12 of employees cost and administration & general expenses) | 127.00
|
| One month average cost of stores (O & M) | 22.08
|
| Total requirement for working capital | 518.74
|
The Board has projected working capital requirement of Rs.850 crores against which it has claimed Rs.48.88 crores as interest charges. The Commission has determined the working capital requirement of Rs.518.74 crores for the year 2005-06 as above. The Commission, therefore, allows proportionate interest of Rs.37.71 crores on working capital requirement determined by the Commission now.
7.13.4 Finance Charges
The finance charges are required to cover the service fee, commitment charges, deferred payments’ commission, guarantee charges etc. The Board has estimated these charges at Rs.30 crores keeping in view the proposed investment of Rs.1956 crores for the year 2005-06, which are quite on higher side. The Commission has approved investment plan of Rs.1200 crores and expects finance charges to be of Rs.15.90 crores @ 1.5 % on Rs.1060 crores (approved amount of investment of Rs.1200 crores minus consumer contribution of Rs.140 crores) for the year 2005-06.
The Commission, therefore, approves Rs.15.90 crores as finance charges for the year 2005-06.
7.13.5 Capitalization of Interest
The capitalization of interest charges of Rs.160.64 crores has been estimated by the Board for the year 2005-06. In the Tariff Orders issued earlier, the Commission had allowed capitalization of interest charges in the ratio of net works in progress to total expenditure but excluding the interest charges on working capital. Capitalization of interest charges is, therefore, allowed by the Commission on the same principle for the year 2005-06 also. The amount of capitalization of interest charges works out to Rs.102.20 crores on the basis of approved investment for the year 2005-06.
7.13.6 Interest on Government Loans
The Board has proposed neither any new Government loans nor any payment of earlier loans for the year 2005-06. The Commission has already directed the Board to get the Government loans restructured at the earliest with a view to bring down the rate of interest at par with the prevalent market rate. The amount of interest on Government loans claimed in the ARR by the Board indicates that the Government loans have not been restructured. The Board is silent on the issue as no assurance in this regard has been given in the ARR. Pending restructuring, the Commission allows the same amount of interest of Rs.480.73 crores on Government loans of Rs.4537.53 crores as approved for the year 2004-05 in para 3.14.4 supra.
The Commission, therefore, approves Rs.480.73 crores as interest on government loans for the year 2005-06.
The Government annually pays in cash the balance subsidy after adjustments of the interest payable on Government loans and the electricity duty by the Board. In the truing up exercise for the year 2003-04 in para 2.16 supra, the receivable subsidy payable by the State Government has been recalibrated and assessed at Rs.871.54 crores in place of Rs.857 crores already paid/adjusted as aforesaid. The additional receivable balance subsidy of Rs.14.54 crores remains payable by the Government of Punjab to the Board. This amount of Rs.14.54 crores is to be adjusted against the interest of Rs.480.73 crores payable by the Board on Government loans. As such, the amount of interest actually adjustable by the Government of Punjab against subsidy works out to Rs.466.19 crores only.
7.13.7 Interest on Diversion of Funds
During processing of the ARR for the 2005-06, the Board in its presentation of April 11, 2005 and subsequent submissions of April 22, 2005 had stated that it had inherited liabilities and losses were as a result of inadequate tariffs and lack of regulatory frame work prior to formation of the Commission. As such, it was unfair to penalize the Board for unpaid liabilities and past losses. The Board further stated that it had taken up this issue with the State Government who have taken the position to resolve it in the Financial Restructuring Plan currently under finalization.
Earlier, the State Government had stated that to make new entities viable in post unbundled Board, it is imperative that they start with a clean Balance Sheet. Now, the Government have stated that the 2004-05 Tariff Order has adversely affected the FRP proposals of the Government. However, notwithstanding this, the FRP was being worked out. It also stated that the Commission might also consider revisiting the issue of disallowing interest on loans as such a practice will adversely impact the utility’s credit worthiness and cast a damper on investment in the power sector.
As analysed by the Commission in its earlier Tariff Order (and not disputed by the Government of Punjab or the Board), there is a huge mismatch (amounting to more than Rs.4000 crores) between the assets and liabilities of the Board. Alternately, the Board is carrying accumulated losses of more than Rs.4000 crores. Either way, the Board is compelled to constantly carry a corresponding burden of unproductive debt. Going strictly by commercial principles, the cost of this debt cannot be treated as a pass through, legitimate revenue expenditure. The Government of Punjab itself had stated in its comments on the ARR for the year 2002-03 that interest costs of loans which do not result in benefits to the consumers cannot be passed on to them.
There is only partial justification in the arguments that the consumers must cheerfully bear this burden which is historical and is entirely due to the reason that these losses occurred because tariffs were not raised sufficiently in the past and thus the consumers alone benefited from this cause. There are at least two other equally important reasons for these recurring losses viz. the inability of the Board to achieve reasonable levels of operating efficiencies in the past and the failure of the Government (in the period prior to the commencement of the regulatory regime) to either provide subventions to the Board to liquidate annual losses or to resolve the issue of large unpaid RE subsidies, as was stated, year after year, in the Balance Sheet of the Board.
If the Commission is to go by the letter and spirit of the Electricity Act, 2003, it must decide that it is the obligation of all the three major stakeholders – the Government of Punjab, the Board and the consumers – to discharge such obligations. Even though it is a generally accepted principle of corporate business that accumulated losses have to be taken care of by the owners, the Commission feels that all the three must make broadly similar sacrifices in such situations. Furthermore, the Government of Punjab has accepted its responsibility to clean up the Balance Sheet of the Board and the State Government has been constantly assuring the Commission for the last three years but unfortunately, the required process has not been completed till date.
It may be stated here that the consumers are currently being made to discharge another large obligation from which they deserve relief. In the last few years, the interest rates have fallen all around. Like all other commercial organizations, and also in response to directions of the Commission, the Board has been successfully exchanging its old debts for cheaper and easier loans as a result of which the average interest rate being paid by the Board on the institutional loans has already come down to 7.05–11.5 percent from the earlier rate of 11.5–18 percent. However, the Government of Punjab has shown no such accommodation to the Board in respect of its large portfolio of loans aggregating to Rs.4537.53 crores. Legitimately, the consumers could expect a relief of around Rs.100 crores on this account.
In the above stated circumstances, the Commission feels that the decision to disallow interest cost of Rs.100 crores is just, legal and fair and is in no way harsh. The Commission further feels that within the provisions of the law, the Government of Punjab cannot be directly burdened with any such charges.
On the basis of above decisions, the Commission approves interest and finance charges as given in Table 7.37 below:
Table – 7.37
Interest Charges approved for the year 2005-06
(Rs. in crores)
| Sl.No. | Particulars | Loans o/s as on 31.3.05 | Receipt of loans | Repayment of loans | Loans o/s as on 31.3.06 | Amount of interest
|
|---|
| 1 | 2 | 3 | 4 | 5 | 6 | 7
|
| 1. | As per ARR (other than WCL & Govt. loans) | 4124.66 | 1876.00 | 840.19 | 5160.47 | 565.37
|
| 2. | Approved by Commission(other than WCL & Govt. loans) | 3825.66 | *1060.00 | 840.19 | 4045.47 | 479.27
|
| 3. | Working capital loan | 600.00 | 518.74 | 600.00 | 518.74 | 37.71
|
| 4. | Government loans | 4537.53 | - | - | 4537.53 | 480.73
|
| 5. | Total (2+3+4) | 8963.19 | 1578.74 | 1440.19 | 9101.74 | 997.71
|
| 6. | Add finance charges | - | - | - | - | 15.90
|
| 7. | Grand total | | | | | 1013.61
|
| 8. | Less capitalization | - | - | - | - | 102.20
|
| 9. | Net interest & finance charges | - | - | - | - | 911.41
|
*Receipt of loans of Rs.1060.00 crores = Approved investment of Rs. 1200 crores –consumer contribution of Rs.140 crores
Thus, net interest and finance charges work out to Rs.911.41 crores for the year 2005-06. Out of this amount, Rs.100 crores is to be disallowed on account of diversion of capital fund for revenue purposes for the year 2005-06 as was decided by the Commission in para 7.15.8 of the Tariff Order for the year 2004-05. The net interest and finance charges, thus, work out to Rs.811.41 crores for the year
2005-06.
The Commission, therefore, approves net interest and finance charges of
Rs.811.41 crores net of capitalization of Rs.102.20 crores for the year 2005-06.
7.14 NET FIXED ASSETS AND RETURN
The Board has claimed Rs.206.37 crores for the year 2005-06 towards 3% return on net fixed assets at the beginning of the year 2005-06 as per Section 59 of the Electricity (Supply) Act, 1948 read with Section 61 of the Electricity Act, 2003. The return on net fixed assets approved by the Commission for the years 2003-04 (actuals/approved), 2004-05 and projections for the year 2005-06 are given in Table 7.38 below:
Table – 7.38
Capital Base and Return
(Rs. in crores)
| Particulars | 03-04(Actuals/Appd.) | 04-05(Appd.) | 05-06(Proj.)
|
|---|
| 1 | 2 | 3 | 4
|
| Gross block | 12920.62 | 13407.35 | 13941.35
|
| Less: Accumulated depreciation | 4360.24 | 4964.01 | 5555.27
|
| Net block | 8560.38 | 8443.33 | 8386.08
|
| Less: Consumers contribution | 1229.73 | 1369.95 | 1506.94
|
| Net fixed assets | 7330.65 | 7073.39 | 6879.14
|
| Reasonable return @3% of NFA | 219.92 | 212.20 | 206.37
|
The amount of works-in- progress and fixed assets as per balance sheet for the year 2003-04 is given in Table 7.39 below:
Table – 7.39
(Rs. in crores)
| Sr. No | Particulars | WIP | Fixed Assets
|
|---|
| 1 | 2 | 3 | 4
|
| 1. | As on 31.3.2004
Add capital exp. in 04-05
Total:
Less transferred to fixed assets | 2382.49
*1009.00
3391.49
494.00 | 13407.35
(+)494.00
|
| 2. | As on 31.3.2005
Add capital exp. in 05-06
Total:
Less transferred to fixed assets | 2897.49
**1200.00
4097.49
860.87 | 13901.35(+)
860.87
|
| 3. | As on 31.3.2006 | 3236.62 | 14762.22
|
* Approved investments for 2004-05
* * Approved investments for 2005-06
The working of accumulated depreciation and consumers’ contribution as on March 31, 2005 is given in Table 7.40 below:
Table – 7.40
(Rs. in crores)
| Accumulated Depreciation |
|
| As on 31.3.2004 – as per accounts | 4947.70
|
| Add: Depreciation for 2004-05 | 591.25
|
| As on 31.3.2005 | 5538.95
|
| Consumers Contribution |
|
| As on 31.3.2004 – as per accounts | 1369.95
|
| Addition during the year 2004-05 (as approved by the Commission) | *140.00
|
| As on 31.3.2005 | 1509.95
|
* Consumers’ contribution for the year assumed at the same level as for the previous year
In view of above, the return for the year 2005-06 is worked out in Table 7.41 below:
Table – 7.41
(Rs. in crores)
| Sr. No. | Particulars | 2005-06
|
|---|
| 1 | 2 | 3
|
| 1. | Original cost of fixed assets at the beginning of the year | 13901.35
|
| 2. | Less: Accumulated depreciation | 5538.95
|
| 3. | Net block (1-2) | 8362.40
|
| 4. | Less: Consumers contribution | 1509.95
|
| 5. | Net fixed assets at the beginning of the year (3-4) | 6852.45
|
| 6. | Return at 3% on NFA | 205.57
|
The Commission, therefore, approves Rs.205.57 crores as return on net fixed assets for the year 2005-06.
C. MISCELLANEOUS REVENUE (NON TARIFF INCOME)
In the ARR for the year 2005-06, the Board has submitted actuals of non tariff income for the year 2003-04, revised estimates for the year 2004-05 and projections for the year 2005-06 as given in Table 7.42 below:
Table – 7.42
Non Tariff Income
(Rs. in crores)
| Sr. No. | Particulars | 2003-04(Actuals) | 2004-05(R.E.) | 2005-06(Proj.)
|
|---|
| 1 | 2 | 3 | 4 | 5
|
|---|
| 1. | Meter/service rent | 107.77 | 112.00 | 115.50
|
| 2. | Late payment surcharge | 69.78 | 73.00 | 74.80
|
| 3. | Theft/pilferage of energy | 18.61 | 20.00 | 21.00
|
| 4. | Misc. receipts | 95.04 | 97.60 | 99.00
|
| 5. | Misc. charges (except PLEC) | 18.36 | 19.00 | 20.00
|
| 6. | Wheeling charges | 0.68 | 2.00 | 2.50
|
| 7. | Interest on staff loans & adv. | 2.46 | 0.70 | 0.80
|
| 8. | Income from trading | 3.92 | 4.50 | 5.00
|
| 9. | Income staff welfare activities | 0.03 | 0.05 | 0.10
|
| 10. | Excess on verification | 0.29 | 1.05 | 1.20
|
| 11. | Investments & bank balances | 0.01 | 0.10 | 0.10
|
| 12. | Prior period income | 23.25 | 00.00 | 00.00
|
| 13. | Net charged to revenue | 340.20 | *330.00 | 340.00
|
* Re-revised to Rs. 331 crores as per presentation dated April 11, 2005
The actuals for the year 2003-04 work out to Rs.316.95 crores after excluding the prior period non tariff income of Rs.23.25 crores. The Commission has approved Rs.316.95 crores as non tariff income for the year 2003-04 as per actuals. The non tariff income for the year 2004-05 has been approved at Rs.331 crores as revised by the Board for the year 2004-05.
The Board has projected non tariff income of Rs.340 crores for the year 2005-06 which is higher by Rs.23.05 crores and Rs.9 crores than the approved non tariff income for the year 2003-04 and 2004-05 respectively.
The Commission, therefore, approves Rs.340 crores as non tariff income for the year 2005-06.
7.15 REVENUE FROM EXISTING TARIFF
Revenue from existing tariff as projected by the Board for the year 2005-06 is Rs.7195 crores. The Commission notes that the consumption of energy by various categories of consumers as estimated by the Board is at variance with the expected energy consumption for the year 2005-06. For estimating sales for the year 2005-06, the Commission has applied the CAGR for 2000-01 to 2003-04 to the approved sales for the year 2004-05. The change in consumer mix has resulted in difference in the amount of revenue from existing tariff as assessed by the Board. In view of the changes in the category-wise sales approved by the Commission, the expected revenue from existing tariff will work out to Rs.7023.47 crores as per details given in Table 7.43 below:
Table – 7.43
Revenue from Existing Tariff
| Sr. No. | Category of consumers | Energy sales (MU) | Tariff rates(p/unit) | Revenue (Rs. in crores)
|
|---|
| 1 | 2 | 3 | 4 | 5
|
| 1. | Domestic
|
| a) | Up to 100 units | 3040 | 200 | 608.00
|
| b) | 101-300 units | 1382 | 334 | 461.58
|
| c) | Above 300 units | 1106 | 353 | 390.41
|
| | Total | 5528 | | 1459.99
|
| 2. | NRS | 1444 | 384 | 554.49
|
| 3. | Public lighting | 123 | 384 | 47.23
|
| 4. | Industrial
|
| a) | SP | 707 | 306 | 216.34
|
| b) | MS | 1581 | 337 | 532.79
|
| c) | LS | 6979 | 337 | 2351.92
|
| | Total | 9267 | | 3101.05
|
| 5. | Bulk supply | 460 | 357 | 164.22
|
| 6. | Railway traction | 123 | 402 | 49.45
|
| 7. | Common pool | 381 | | 75.37
|
| 8. | Outside state | 360 | | 89.46
|
| 9. | Total | 17686 | | 5541.26
|
| 10. | AP consumption | 7000 | 194 | 1358.00
|
| 11. | Total | 24686 | | 6899.26
|
| 12. | Add MMC and Other charges | -- | -- | 189.21
|
| 13. | Grand Total | -- | -- | 7088.47
|
| 14. | Less concessions for Rural Domestic consumers | | | 65.00
|
| 15. | Net revenue from existing tariff | | | 7023.47
|
The Commission, therefore, approves the revenue from existing tariff at
Rs. 7023.47 crores for the year 2005-06 as worked out above.
D. REVENUE REQUIREMENT
The summery of the revenue requirement of the Board for the year 2005-06 as analyzed in the preceding paragraphs is given in Table 7.44 below:
Table – 7.44
Revenue Requirement for the year 2005-06
(Rs. in crores)
| Sr. No. | Item of expense | Proposed by the Board | Approved by the Commission
|
|---|
| 1 | 2 | 3 | 4
|
| 1. | Cost of fuel | 2334.05 | 2176.19
|
| 2. | Cost of power purchase | 3553.00 | 2259.66
|
| 3. | Employee costs | 1700.00 | 1473.63
|
| 4. | O&M expenses | 265.00 | 265.00
|
| 5. | Administration and general expenses | 55.00 | 50.31
|
| 6. | Depreciation | 624.04 | 621.77
|
| 7. | Interest charges | 966.70 | 811.41
|
| 8. | Return on NFA | 206.37 | 205.57
|
| 9. | Total revenue requirement | 9704.16 | 7863.54
|
| 10. | Less: non tariff income | 340.00 | 340.00
|
| 11. | Net revenue requirement (9-10) | 9364.16 | 7523.54
|
| 12. | Revenue from tariff | 7195.00 | 7023.47
|
| 13. | Gap (11-12) | 2169.16 | 500.07
|
| 14. | Gap for 2004-05 | - | 268.58
|
| 15. | Total gap (13+14) | 2169.16 | 768.65
|
| 16. | Revenue surplus carried over | (-)291.00 | -
|
| 17. | Additional revenue from proposed tariff | (-)1002.00 | -
|
| 18. | Regulatory asset | 876.00 | -
|
| 19. | Energy sales (MU) | 25837 | 24686
|
From above, it is evident that there will be revenue deficit of Rs.500.07 crores for the year 2005-06. After taking into account the revenue deficit of Rs.268.58 crores for the year 2004-05, there will be total revenue deficit of 768.65 crores at the end of March 2006.
Annual Revenue Requirement for the year 2005-06 is assessed at Rs.7863.54 crores with energy sales of 24686 MU. The average cost of supply with this revenue requirement comes out to 318.54 paise per unit say 319 paise per unit. The corresponding figure for the average unit cost for the year 2004-05, as worked out by the Commission, was 310 paise as per Tariff Order dated November 30, 2004. The concept of average cost of supply is further discussed in detail in para 9.2 of Chapter-9 of this Order.